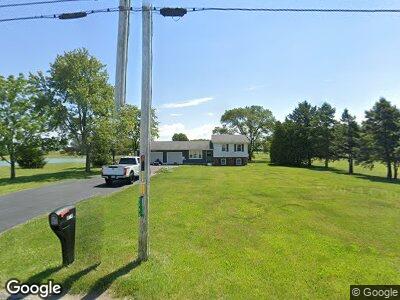
8484 Huffman Rd Cygnet, OH 43413
Estimated Value: $240,000 - $317,000
3
Beds
1
Bath
1,490
Sq Ft
$178/Sq Ft
Est. Value
About This Home
This home is located at 8484 Huffman Rd, Cygnet, OH 43413 and is currently estimated at $264,663, approximately $177 per square foot. 8484 Huffman Rd is a home located in Wood County with nearby schools including Elmwood Elementary School, Elmwood Middle School, and Elmwood High School.
Ownership History
Date
Name
Owned For
Owner Type
Purchase Details
Closed on
Sep 21, 2018
Sold by
Boggia Raymond and Boggia Mary
Bought by
Smith Kenneth J and Smith Patti
Current Estimated Value
Home Financials for this Owner
Home Financials are based on the most recent Mortgage that was taken out on this home.
Original Mortgage
$159,493
Outstanding Balance
$141,268
Interest Rate
4.37%
Mortgage Type
FHA
Purchase Details
Closed on
Jun 21, 1999
Sold by
Wagner Thomas J and Wagner Lisa R
Bought by
Boggia Raymond and Boggia Mary
Home Financials for this Owner
Home Financials are based on the most recent Mortgage that was taken out on this home.
Original Mortgage
$100,000
Interest Rate
7.06%
Purchase Details
Closed on
Jun 15, 1999
Sold by
Wagner Thomas J and Wagner Lisa R
Bought by
Boggia Raymond and Boggia Mary
Home Financials for this Owner
Home Financials are based on the most recent Mortgage that was taken out on this home.
Original Mortgage
$100,000
Interest Rate
7.06%
Purchase Details
Closed on
Oct 27, 1992
Bought by
Wagner Thomas J
Create a Home Valuation Report for This Property
The Home Valuation Report is an in-depth analysis detailing your home's value as well as a comparison with similar homes in the area
Home Values in the Area
Average Home Value in this Area
Purchase History
| Date | Buyer | Sale Price | Title Company |
|---|---|---|---|
| Smith Kenneth J | $165,000 | None Available | |
| Boggia Raymond | $134,900 | Perrysburg Title Agency Inc | |
| Wagner Thomas J | $78,000 | -- |
Source: Public Records
Mortgage History
| Date | Status | Borrower | Loan Amount |
|---|---|---|---|
| Open | Smith Kenneth | $7,530 | |
| Open | Smith Kenneth J | $159,493 | |
| Closed | Boggia Ryamond | $100,160 | |
| Closed | Boggia Ray C | $50,000 | |
| Closed | Boggia Raymond | $100,000 |
Source: Public Records
Tax History Compared to Growth
Tax History
| Year | Tax Paid | Tax Assessment Tax Assessment Total Assessment is a certain percentage of the fair market value that is determined by local assessors to be the total taxable value of land and additions on the property. | Land | Improvement |
|---|---|---|---|---|
| 2023 | $2,406 | $57,680 | $10,990 | $46,690 |
| 2021 | $2,318 | $49,180 | $9,070 | $40,110 |
| 2020 | $2,322 | $49,180 | $9,070 | $40,110 |
| 2019 | $1,947 | $41,800 | $8,650 | $33,150 |
| 2018 | $1,489 | $41,800 | $8,650 | $33,150 |
| 2017 | $1,469 | $41,800 | $8,650 | $33,150 |
| 2016 | $1,146 | $35,780 | $6,900 | $28,880 |
| 2015 | $1,146 | $35,780 | $6,900 | $28,880 |
| 2014 | $1,114 | $35,780 | $6,900 | $28,880 |
| 2013 | $1,151 | $35,780 | $6,900 | $28,880 |
Source: Public Records
Map
Nearby Homes
- 10243 S Dixie Hwy
- 13921 Defiance Pike
- 13863 Mermill Rd
- 13451 Freyman Rd
- 140 Lockhart Ave
- 215 Ada Ave
- 319 Sunrise Dr
- 0 Sand Ridge Rd Unit Lot 5 6095897
- 0 Sand Ridge Rd Unit Lot 4 6095895
- 0 Sand Ridge Rd Unit Lot 1
- 1000 Deer Ridge Run
- 994 Deer Ridge Run
- 930 E Broadway St Unit 135
- 504 N Main St
- 410 S Maple St
- 1021 Melrose St
- 416 Donbar Dr
- 1052 Melrose St
- 930 Pine Valley Dr
- 924 Pine Valley Dr