8488 Ickes Rd Wooster, OH 44691
Estimated Value: $239,727
--
Bed
--
Bath
8,000
Sq Ft
$30/Sq Ft
Est. Value
About This Home
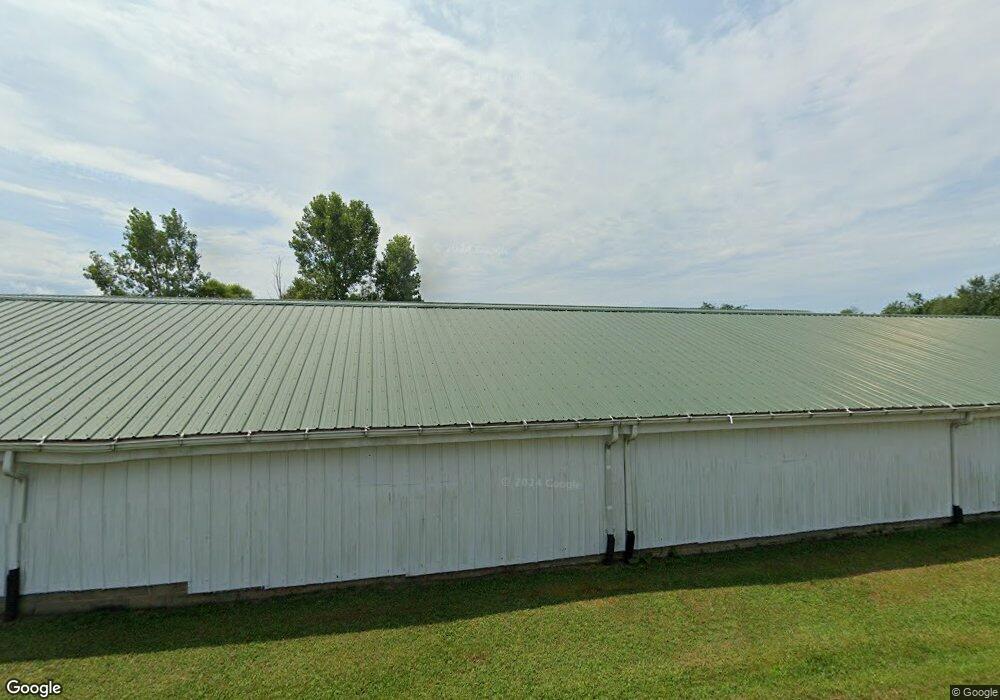
This home is located at 8488 Ickes Rd, Wooster, OH 44691 and is currently estimated at $239,727, approximately $29 per square foot. 8488 Ickes Rd is a home located in Wayne County with nearby schools including Northwestern Elementary School, Northwestern Middle School, and Northwestern High School.
Ownership History
Date
Name
Owned For
Owner Type
Purchase Details
Closed on
Dec 1, 2016
Sold by
Blaz Ronald A
Bought by
Atlantix Holding Llc
Current Estimated Value
Purchase Details
Closed on
Apr 25, 2011
Sold by
Yoder Aden A and Yoder Elsie P
Bought by
Blaz Ronald A
Purchase Details
Closed on
Apr 19, 2011
Sold by
Yoder Aden A and Yoder Elsie P
Bought by
Blaz Ronald A
Purchase Details
Closed on
Aug 29, 2003
Sold by
Smagola John S and Smagola Dianne L
Bought by
Yoder Dan M and Yoder Gladys
Home Financials for this Owner
Home Financials are based on the most recent Mortgage that was taken out on this home.
Original Mortgage
$77,600
Interest Rate
6.18%
Mortgage Type
Commercial
Purchase Details
Closed on
May 10, 2001
Sold by
Case Farms Of Ohio
Bought by
Smagola John S and Smagola Dianne L
Purchase Details
Closed on
Feb 10, 1986
Bought by
Linscott James H and Linscott Patsy
Create a Home Valuation Report for This Property
The Home Valuation Report is an in-depth analysis detailing your home's value as well as a comparison with similar homes in the area
Home Values in the Area
Average Home Value in this Area
Purchase History
| Date | Buyer | Sale Price | Title Company |
|---|---|---|---|
| Atlantix Holding Llc | -- | None Available | |
| Blaz Ronald A | -- | -- | |
| Blaz Ronald A | -- | -- | |
| Yoder Dan M | $97,000 | -- | |
| Smagola John S | $18,000 | -- | |
| Linscott James H | -- | -- |
Source: Public Records
Mortgage History
| Date | Status | Borrower | Loan Amount |
|---|---|---|---|
| Previous Owner | Yoder Dan M | $77,600 |
Source: Public Records
Tax History Compared to Growth
Tax History
| Year | Tax Paid | Tax Assessment Tax Assessment Total Assessment is a certain percentage of the fair market value that is determined by local assessors to be the total taxable value of land and additions on the property. | Land | Improvement |
|---|---|---|---|---|
| 2024 | $1,687 | $37,790 | $11,560 | $26,230 |
| 2023 | $1,687 | $37,790 | $11,560 | $26,230 |
| 2022 | $1,730 | $37,790 | $11,560 | $26,230 |
| 2021 | $1,731 | $37,790 | $11,560 | $26,230 |
| 2020 | $1,742 | $37,790 | $11,560 | $26,230 |
| 2019 | $1,534 | $30,290 | $7,220 | $23,070 |
| 2018 | $1,510 | $30,290 | $7,220 | $23,070 |
| 2017 | $1,487 | $30,290 | $7,220 | $23,070 |
| 2016 | $1,517 | $30,290 | $7,220 | $23,070 |
| 2015 | $1,468 | $30,290 | $7,220 | $23,070 |
| 2014 | $1,426 | $30,290 | $7,220 | $23,070 |
| 2013 | $1,687 | $35,260 | $9,070 | $26,190 |
Source: Public Records
Map
Nearby Homes