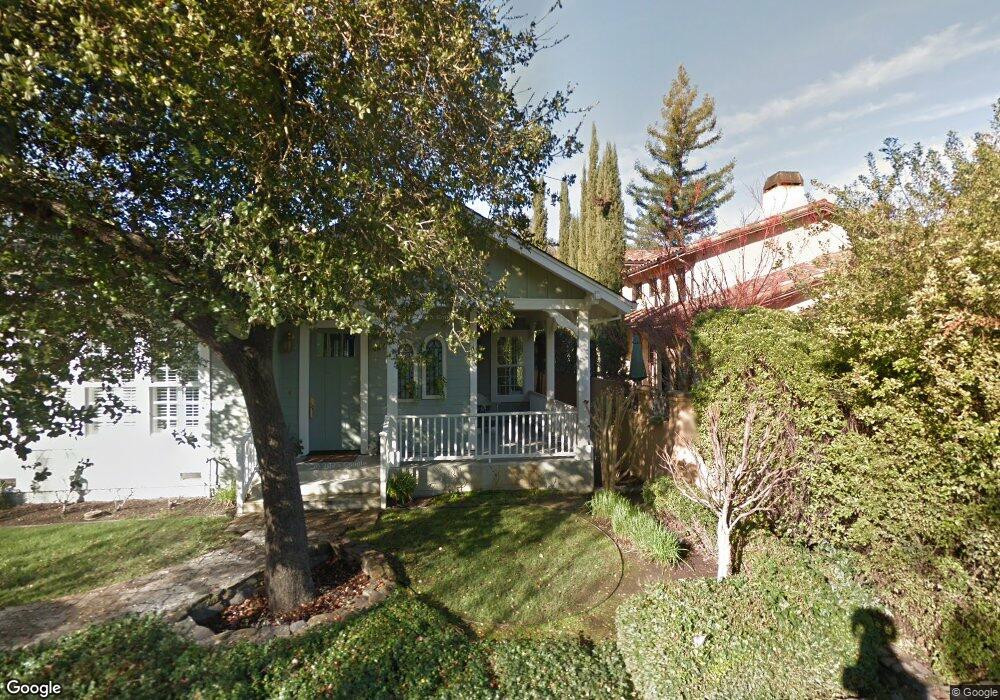
849 3rd St E Sonoma, CA 95476
Estimated Value: $1,878,000 - $2,618,000
3
Beds
3
Baths
4,143
Sq Ft
$531/Sq Ft
Est. Value
About This Home
This home is located at 849 3rd St E, Sonoma, CA 95476 and is currently estimated at $2,197,868, approximately $530 per square foot. 849 3rd St E is a home located in Sonoma County with nearby schools including Prestwood Elementary School, Adele Harrison Middle School, and Creekside High School.
Ownership History
Date
Name
Owned For
Owner Type
Purchase Details
Closed on
Feb 18, 2026
Sold by
John Murphy and Ellen Murphy
Bought by
Murphy Revocable Trust and Murphy
Current Estimated Value
Home Financials for this Owner
Home Financials are based on the most recent Mortgage that was taken out on this home.
Original Mortgage
$1,873,687
Outstanding Balance
$1,873,687
Interest Rate
6.09%
Mortgage Type
Reverse Mortgage Home Equity Conversion Mortgage
Estimated Equity
$324,181
Purchase Details
Closed on
Dec 20, 2011
Sold by
Murphy Joyn T and Murphy Ellen M
Bought by
Murphy John T and Murphy Ellen M
Home Financials for this Owner
Home Financials are based on the most recent Mortgage that was taken out on this home.
Original Mortgage
$400,000
Interest Rate
3%
Mortgage Type
New Conventional
Purchase Details
Closed on
May 6, 2008
Sold by
Murphy John T and Murphy Ellen M
Bought by
Murphy John T and Murphy Ellen M
Home Financials for this Owner
Home Financials are based on the most recent Mortgage that was taken out on this home.
Original Mortgage
$417,000
Interest Rate
5.8%
Mortgage Type
New Conventional
Purchase Details
Closed on
Apr 25, 2008
Sold by
Murphy John T and Murphy Ellen M
Bought by
Murphy John T and Murphy Ellen M
Home Financials for this Owner
Home Financials are based on the most recent Mortgage that was taken out on this home.
Original Mortgage
$417,000
Interest Rate
5.8%
Mortgage Type
New Conventional
Purchase Details
Closed on
Aug 16, 2005
Sold by
Murphy John T and Murphy Ellen M
Bought by
Murphy John and Murphy Ellen
Home Financials for this Owner
Home Financials are based on the most recent Mortgage that was taken out on this home.
Original Mortgage
$350,000
Interest Rate
5.87%
Mortgage Type
New Conventional
Purchase Details
Closed on
Jul 28, 2004
Sold by
Feig Stanley F and Feig Noreen D
Bought by
Syufy Raymond and Syufy Ricki
Home Financials for this Owner
Home Financials are based on the most recent Mortgage that was taken out on this home.
Original Mortgage
$900,000
Interest Rate
6.29%
Mortgage Type
Construction
Purchase Details
Closed on
Jul 24, 2003
Sold by
Sherwood Robert S and Hunter Victor
Bought by
Murphy John and Murphy Ellen
Create a Home Valuation Report for This Property
The Home Valuation Report is an in-depth analysis detailing your home's value as well as a comparison with similar homes in the area
Home Values in the Area
Average Home Value in this Area
Purchase History
| Date | Buyer | Sale Price | Title Company |
|---|---|---|---|
| Murphy Revocable Trust | -- | Placer Title Company | |
| Murphy John T | -- | Fidelity National Title Co | |
| Murphy John T | -- | Fidelity National Title Co | |
| Murphy John T | -- | Fidelity National Title Co | |
| Murphy John T | -- | Fidelity National Title Co | |
| Murphy John | -- | Fidelity Natl Title Co | |
| Murphy John T | -- | Fidelity Natl Title Co | |
| Syufy Raymond | $2,350,000 | Fidelity National Title Co | |
| Murphy John | $465,000 | Fidelity Natl Title Co |
Source: Public Records
Mortgage History
| Date | Status | Borrower | Loan Amount |
|---|---|---|---|
| Open | Murphy Revocable Trust | $1,873,687 | |
| Closed | Murphy Revocable Trust | $1,873,687 | |
| Previous Owner | Murphy John T | $400,000 | |
| Previous Owner | Murphy John T | $417,000 | |
| Previous Owner | Murphy John T | $350,000 | |
| Previous Owner | Syufy Raymond | $900,000 |
Source: Public Records
Tax History
| Year | Tax Paid | Tax Assessment Tax Assessment Total Assessment is a certain percentage of the fair market value that is determined by local assessors to be the total taxable value of land and additions on the property. | Land | Improvement |
|---|---|---|---|---|
| 2025 | $9,691 | $767,057 | $242,635 | $524,422 |
| 2024 | $9,691 | $752,018 | $237,878 | $514,140 |
| 2023 | $9,691 | $737,273 | $233,214 | $504,059 |
| 2022 | $9,323 | $722,818 | $228,642 | $494,176 |
| 2021 | $9,355 | $708,646 | $224,159 | $484,487 |
| 2020 | $9,091 | $701,381 | $221,861 | $479,520 |
| 2019 | $8,889 | $687,629 | $217,511 | $470,118 |
| 2018 | $9,521 | $674,147 | $213,247 | $460,900 |
| 2017 | $8,730 | $660,929 | $209,066 | $451,863 |
| 2016 | $8,125 | $647,970 | $204,967 | $443,003 |
| 2015 | $7,866 | $638,238 | $201,889 | $436,349 |
| 2014 | $7,732 | $625,737 | $197,935 | $427,802 |
Source: Public Records
Map
Nearby Homes
Your Personal Tour Guide
Ask me questions while you tour the home.