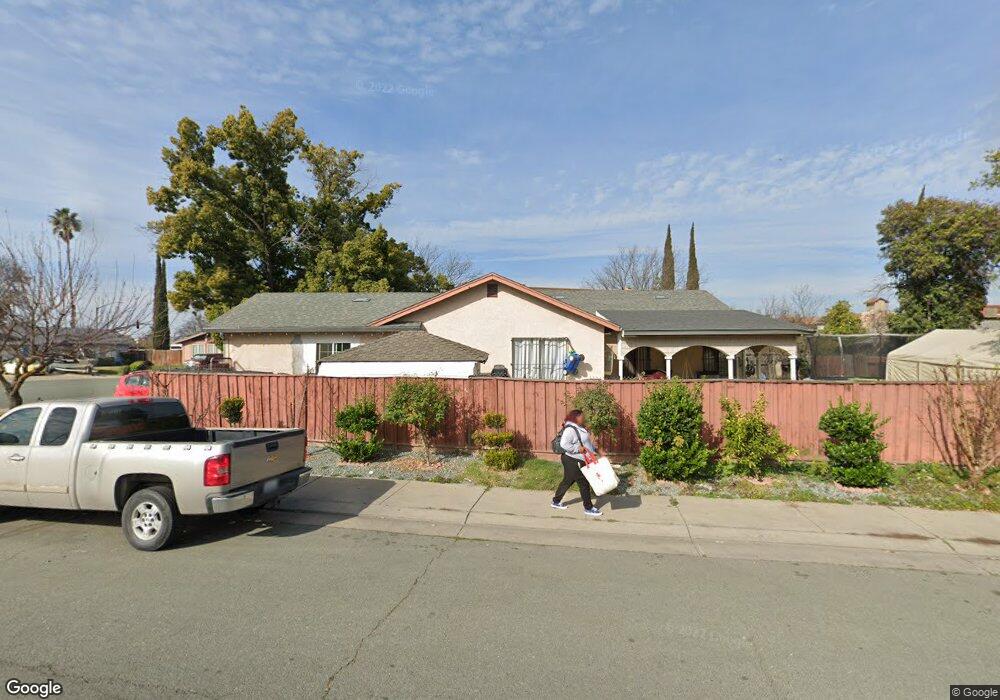
849 Cambridge Dr Stockton, CA 95207
Lincoln Village NeighborhoodEstimated Value: $304,000 - $419,136
3
Beds
2
Baths
1,541
Sq Ft
$234/Sq Ft
Est. Value
About This Home
This home is located at 849 Cambridge Dr, Stockton, CA 95207 and is currently estimated at $360,284, approximately $233 per square foot. 849 Cambridge Dr is a home located in San Joaquin County with nearby schools including John R. Williams School, Sierra Middle School, and Lincoln High School.
Ownership History
Date
Name
Owned For
Owner Type
Purchase Details
Closed on
Sep 8, 2003
Sold by
Telles Jesus
Bought by
Acosta Francisco
Current Estimated Value
Home Financials for this Owner
Home Financials are based on the most recent Mortgage that was taken out on this home.
Original Mortgage
$178,640
Outstanding Balance
$83,213
Interest Rate
6.3%
Mortgage Type
FHA
Estimated Equity
$277,071
Purchase Details
Closed on
Jan 24, 2002
Sold by
Dangeli Minhtham Tran
Bought by
Acosta Francisco and Telles Jesus
Home Financials for this Owner
Home Financials are based on the most recent Mortgage that was taken out on this home.
Original Mortgage
$147,417
Interest Rate
7.04%
Mortgage Type
FHA
Purchase Details
Closed on
Dec 10, 2001
Sold by
Tellez Maria Reyes
Bought by
Tellez Jesus
Home Financials for this Owner
Home Financials are based on the most recent Mortgage that was taken out on this home.
Original Mortgage
$147,417
Interest Rate
7.04%
Mortgage Type
FHA
Create a Home Valuation Report for This Property
The Home Valuation Report is an in-depth analysis detailing your home's value as well as a comparison with similar homes in the area
Home Values in the Area
Average Home Value in this Area
Purchase History
| Date | Buyer | Sale Price | Title Company |
|---|---|---|---|
| Acosta Francisco | -- | Chicago Title Co | |
| Acosta Francisco | $149,500 | Alliance Title Company | |
| Tellez Jesus | -- | Alliance Title Company |
Source: Public Records
Mortgage History
| Date | Status | Borrower | Loan Amount |
|---|---|---|---|
| Open | Acosta Francisco | $178,640 | |
| Previous Owner | Acosta Francisco | $147,417 | |
| Closed | Acosta Francisco | $8,970 |
Source: Public Records
Tax History Compared to Growth
Tax History
| Year | Tax Paid | Tax Assessment Tax Assessment Total Assessment is a certain percentage of the fair market value that is determined by local assessors to be the total taxable value of land and additions on the property. | Land | Improvement |
|---|---|---|---|---|
| 2025 | $2,998 | $252,589 | $64,484 | $188,105 |
| 2024 | $2,935 | $247,637 | $63,220 | $184,417 |
| 2023 | $2,914 | $242,782 | $61,981 | $180,801 |
| 2022 | $2,823 | $238,022 | $60,766 | $177,256 |
| 2021 | $2,785 | $233,356 | $59,575 | $173,781 |
| 2020 | $2,784 | $230,965 | $58,965 | $172,000 |
| 2019 | $2,740 | $226,437 | $57,809 | $168,628 |
| 2018 | $2,689 | $221,998 | $56,676 | $165,322 |
| 2017 | $2,635 | $217,646 | $55,565 | $162,081 |
| 2016 | $2,432 | $198,000 | $51,000 | $147,000 |
| 2014 | $1,865 | $147,000 | $44,000 | $103,000 |
Source: Public Records
Map
Nearby Homes
- 4720 Greensboro Way
- 4718 Hillsboro Way
- 4621 Hillsboro Way
- 505 Coventry Dr
- 510 E Bianchi Rd Unit 2
- 5416 Ridgeway Ave
- 4463 Townehome Dr
- 4478 Calandria St Unit 4
- 5511 Audrey Dr
- 408 E Bianchi Rd Unit 4
- 4811 Huntington Ln
- 5536 Kermit Ln
- 4428 Calandria St Unit 4
- 215 Coventry Dr
- 5622 Jeffrey Ct
- 5271 Barbados Cir
- 4419 La Cresta Way Unit 1
- 150 Gateway Ct
- 428 Caribrook Way Unit 3
- 4465 Dorset St
- 843 Cambridge Dr
- 857 Cambridge Dr
- 4923 Greensboro Way
- 835 Cambridge Dr
- 846 Cambridge Dr
- 838 Cambridge Dr
- 4845 Greensboro Way
- 829 Cambridge Dr
- 817 Cambridge Dr
- 830 Cambridge Dr
- 823 Cambridge Dr
- 4837 Greensboro Way
- 826 Cambridge Dr
- 4949 Greensboro Way
- 827 Birmingham Ct
- 4910 Greensboro Way
- 4878 Greensboro Way
- 819 Birmingham Ct
- 805 Cambridge Dr
- 812 Cambridge Dr