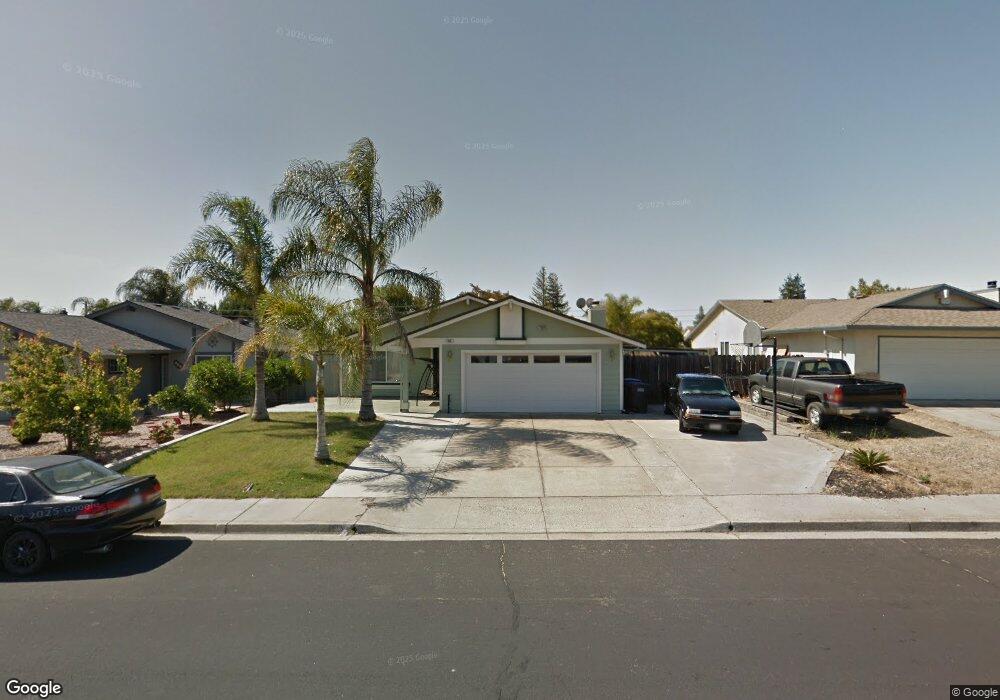
849 Chianti Way Oakley, CA 94561
South Oakley NeighborhoodEstimated Value: $551,552 - $633,000
3
Beds
2
Baths
--
Sq Ft
--
Built
About This Home
This home is located at 849 Chianti Way, Oakley, CA 94561 and is currently estimated at $575,138. 849 Chianti Way is a home located in Contra Costa County with nearby schools including Laurel Elementary School, O'Hara Park Middle School, and Freedom High School.
Ownership History
Date
Name
Owned For
Owner Type
Purchase Details
Closed on
May 20, 2019
Sold by
Montoya J Cesar and Anaya Montoya Maria R
Bought by
Montoya J Cesar
Current Estimated Value
Home Financials for this Owner
Home Financials are based on the most recent Mortgage that was taken out on this home.
Original Mortgage
$284,350
Outstanding Balance
$249,493
Interest Rate
4.1%
Mortgage Type
New Conventional
Estimated Equity
$325,645
Purchase Details
Closed on
Apr 3, 2003
Sold by
Aiello Michael V
Bought by
Montoya J Cesar and Anaya Montoya Maria R
Home Financials for this Owner
Home Financials are based on the most recent Mortgage that was taken out on this home.
Original Mortgage
$219,200
Interest Rate
5.73%
Mortgage Type
Purchase Money Mortgage
Purchase Details
Closed on
Mar 23, 1999
Sold by
Aiello Deborah M
Bought by
Aiello Michael
Home Financials for this Owner
Home Financials are based on the most recent Mortgage that was taken out on this home.
Original Mortgage
$148,200
Interest Rate
6.73%
Mortgage Type
Purchase Money Mortgage
Create a Home Valuation Report for This Property
The Home Valuation Report is an in-depth analysis detailing your home's value as well as a comparison with similar homes in the area
Home Values in the Area
Average Home Value in this Area
Purchase History
| Date | Buyer | Sale Price | Title Company |
|---|---|---|---|
| Montoya J Cesar | -- | Amrock Title California Inc | |
| Montoya J Cesar | $274,000 | Old Republic Title | |
| Aiello Michael | -- | North American Title Co | |
| Aiello Michael | $156,000 | North American Title Co |
Source: Public Records
Mortgage History
| Date | Status | Borrower | Loan Amount |
|---|---|---|---|
| Open | Montoya J Cesar | $284,350 | |
| Closed | Montoya J Cesar | $219,200 | |
| Previous Owner | Aiello Michael | $148,200 | |
| Closed | Montoya J Cesar | $54,800 |
Source: Public Records
Tax History Compared to Growth
Tax History
| Year | Tax Paid | Tax Assessment Tax Assessment Total Assessment is a certain percentage of the fair market value that is determined by local assessors to be the total taxable value of land and additions on the property. | Land | Improvement |
|---|---|---|---|---|
| 2025 | $5,290 | $396,821 | $166,548 | $230,273 |
| 2024 | $5,231 | $389,041 | $163,283 | $225,758 |
| 2023 | $5,231 | $381,414 | $160,082 | $221,332 |
| 2022 | $5,190 | $373,937 | $156,944 | $216,993 |
| 2021 | $5,106 | $366,606 | $153,867 | $212,739 |
| 2019 | $4,843 | $355,734 | $149,304 | $206,430 |
| 2018 | $4,718 | $348,760 | $146,377 | $202,383 |
| 2017 | $4,519 | $328,000 | $137,664 | $190,336 |
| 2016 | $3,827 | $280,000 | $117,519 | $162,481 |
| 2015 | $3,675 | $260,000 | $109,124 | $150,876 |
| 2014 | $3,187 | $215,500 | $90,447 | $125,053 |
Source: Public Records
Map
Nearby Homes
- 317 Lorenz Dr
- 881 Chianti Way
- 951 Ohara Ct
- 1541 Larkspur Ct
- 4670 Fuschia Way
- 876 Diamante Way
- 0 Almond Dr Unit 41106452
- 4334 Redwood Dr
- 3901-B Rose Ave
- 297 Eagle Nest Dr
- 201 Ohara Ave
- 515 Longhorn Way
- 80 Mandeville Ct
- 436 Clearwood Dr
- 9999 7th St
- 0 Main St Unit 41115212
- The Baxter Plan at The Preserve at Stonewood - The Preserve at Stone Wood
- The Dumont Plan at The Preserve at Stonewood - The Preserve at Stone Wood
- The Carlton Plan at The Preserve at Stonewood - The Preserve at Stone Wood
- The Amber Plan at The Preserve at Stonewood - The Preserve at Stone Wood
- 845 Chianti Way
- 853 Chianti Way
- 857 Chianti Way
- 841 Chianti Way
- 850 Chianti Way
- 846 Chianti Way
- 861 Chianti Way
- 854 Chianti Way
- 837 Chianti Way
- 842 Chianti Way
- 858 Chianti Way
- 1090 Woodglen Dr
- 838 Chianti Way
- 1100 Woodglen Dr
- 865 Chianti Way
- 833 Chianti Way
- 1080 Woodglen Dr
- 862 Chianti Way
- 329 Lorenz Dr
- 325 Lorenz Dr