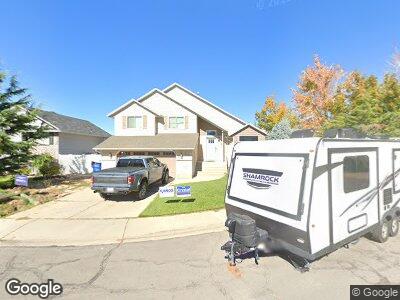
849 E 315 S Orem, UT 84097
Riverside NeighborhoodEstimated Value: $572,370 - $685,000
3
Beds
3
Baths
1,860
Sq Ft
$329/Sq Ft
Est. Value
About This Home
This home is located at 849 E 315 S, Orem, UT 84097 and is currently estimated at $612,343, approximately $329 per square foot. 849 E 315 S is a home located in Utah County with nearby schools including Centennial Elementary, Canyon View Junior High School, and Orem High School.
Ownership History
Date
Name
Owned For
Owner Type
Purchase Details
Closed on
May 22, 2020
Sold by
Hill Wiley B and Hill Rebecca S
Bought by
Huntington Bethany Ann and Huntington Ryan C
Current Estimated Value
Home Financials for this Owner
Home Financials are based on the most recent Mortgage that was taken out on this home.
Original Mortgage
$385,463
Outstanding Balance
$348,950
Interest Rate
3.3%
Mortgage Type
New Conventional
Estimated Equity
$234,792
Purchase Details
Closed on
Sep 14, 2005
Sold by
Chang Kao Chien and Chang Linda
Bought by
Hill Wiley B and Hill Rebecca S
Home Financials for this Owner
Home Financials are based on the most recent Mortgage that was taken out on this home.
Original Mortgage
$155,000
Interest Rate
5.76%
Mortgage Type
Fannie Mae Freddie Mac
Create a Home Valuation Report for This Property
The Home Valuation Report is an in-depth analysis detailing your home's value as well as a comparison with similar homes in the area
Home Values in the Area
Average Home Value in this Area
Purchase History
| Date | Buyer | Sale Price | Title Company |
|---|---|---|---|
| Huntington Bethany Ann | -- | Stewart Title Ins Agency | |
| Hill Wiley B | -- | Mountain West Title Company |
Source: Public Records
Mortgage History
| Date | Status | Borrower | Loan Amount |
|---|---|---|---|
| Open | Huntington Bethany Ann | $385,463 | |
| Previous Owner | Hill Wiley B | $90,200 | |
| Previous Owner | Hill Wiley B | $40,000 | |
| Previous Owner | Hill Wiley B | $155,000 |
Source: Public Records
Tax History Compared to Growth
Tax History
| Year | Tax Paid | Tax Assessment Tax Assessment Total Assessment is a certain percentage of the fair market value that is determined by local assessors to be the total taxable value of land and additions on the property. | Land | Improvement |
|---|---|---|---|---|
| 2024 | $2,340 | $286,110 | $0 | $0 |
| 2023 | $2,202 | $289,410 | $0 | $0 |
| 2022 | $2,288 | $291,280 | $0 | $0 |
| 2021 | $2,013 | $388,200 | $159,500 | $228,700 |
| 2020 | $1,833 | $347,500 | $127,600 | $219,900 |
| 2019 | $1,665 | $328,100 | $117,300 | $210,800 |
| 2018 | $1,673 | $315,100 | $113,800 | $201,300 |
| 2017 | $1,643 | $165,715 | $0 | $0 |
| 2016 | $1,664 | $154,770 | $0 | $0 |
| 2015 | $1,706 | $150,095 | $0 | $0 |
| 2014 | $1,453 | $127,215 | $0 | $0 |
Source: Public Records
Map
Nearby Homes