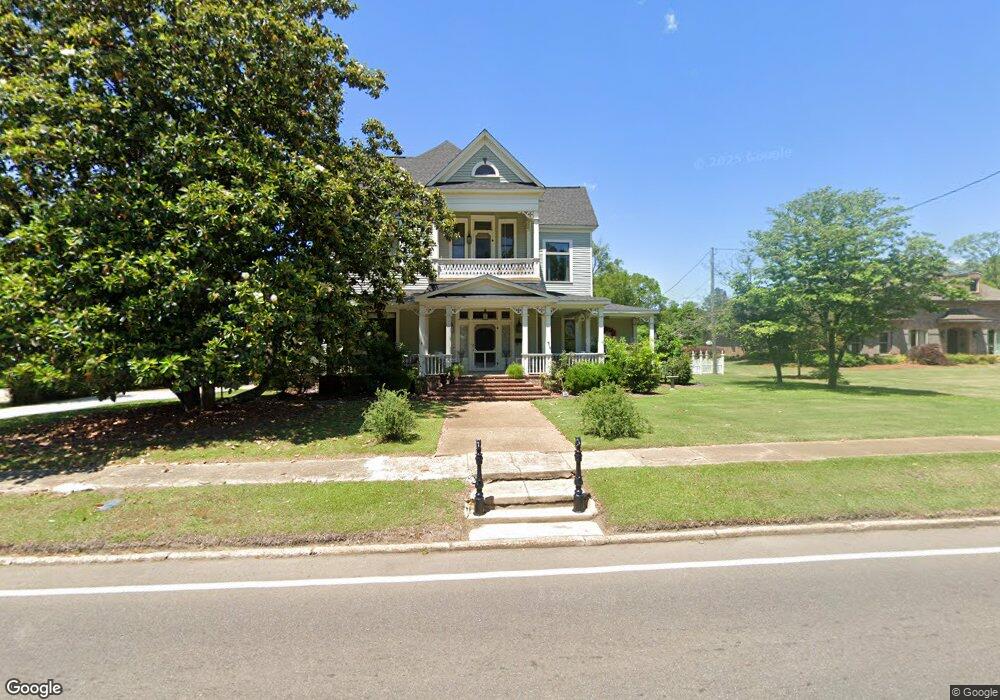
849 E Main St West Point, MS 39773
Estimated Value: $433,000 - $614,000
6
Beds
--
Bath
4,231
Sq Ft
$118/Sq Ft
Est. Value
About This Home
This home is located at 849 E Main St, West Point, MS 39773 and is currently estimated at $497,392, approximately $117 per square foot. 849 E Main St is a home located in Clay County with nearby schools including East Side Elementary School, West Clay Elementary School, and Church Hill Elementary School.
Ownership History
Date
Name
Owned For
Owner Type
Purchase Details
Closed on
Sep 22, 2020
Sold by
Wilson Mark J and Wilson Michelle R
Bought by
Copeland Raymond C and Copeland Karen M
Current Estimated Value
Home Financials for this Owner
Home Financials are based on the most recent Mortgage that was taken out on this home.
Original Mortgage
$434,553
Outstanding Balance
$382,117
Interest Rate
2.9%
Mortgage Type
Unknown
Estimated Equity
$115,275
Purchase Details
Closed on
Oct 30, 2018
Sold by
Sundbeck Cheryl S
Bought by
Wilson Mark J and Wilson Michelle R
Home Financials for this Owner
Home Financials are based on the most recent Mortgage that was taken out on this home.
Original Mortgage
$440,000
Interest Rate
3.94%
Mortgage Type
New Conventional
Create a Home Valuation Report for This Property
The Home Valuation Report is an in-depth analysis detailing your home's value as well as a comparison with similar homes in the area
Purchase History
| Date | Buyer | Sale Price | Title Company |
|---|---|---|---|
| Copeland Raymond C | -- | -- | |
| Wilson Mark J | -- | -- |
Source: Public Records
Mortgage History
| Date | Status | Borrower | Loan Amount |
|---|---|---|---|
| Open | Copeland Raymond C | $434,553 | |
| Previous Owner | Wilson Mark J | $440,000 |
Source: Public Records
Tax History
| Year | Tax Paid | Tax Assessment Tax Assessment Total Assessment is a certain percentage of the fair market value that is determined by local assessors to be the total taxable value of land and additions on the property. | Land | Improvement |
|---|---|---|---|---|
| 2025 | $1,905 | $42,631 | $4,352 | $38,279 |
| 2024 | $1,905 | $42,631 | $4,352 | $38,279 |
| 2023 | $5,258 | $42,631 | $4,352 | $38,279 |
| 2022 | $1,934 | $42,631 | $4,352 | $38,279 |
| 2021 | $1,917 | $42,631 | $4,352 | $38,279 |
| 2020 | $2,201 | $42,631 | $4,352 | $38,279 |
| 2019 | $2,047 | $42,283 | $4,352 | $37,931 |
| 2018 | $1,802 | $39,172 | $4,352 | $34,820 |
| 2017 | $2,928 | $58,759 | $6,529 | $52,230 |
| 2016 | $2,808 | $58,759 | $6,529 | $52,230 |
| 2015 | $2,639 | $53,744 | $6,529 | $47,215 |
| 2014 | $521 | $53,409 | $6,194 | $47,215 |
| 2013 | $521 | $26,021 | $6,194 | $19,827 |
Source: Public Records
Map
Nearby Homes
- 26596 E Main St
- 27045 E Main St
- 26852 E Main St
- 26788 E Main St
- 551 E Westbrook St
- 530 E Morrow St
- 761 E Morrow St
- 123 Cottrell St
- 341 Mccord St
- 238 Calhoun St
- 913 E Westbrook St
- 184 Tournament St
- 228 Mccord St
- 105 Converse Dr
- 507 S Eshman Ave
- 33 Court
- 228 S Division St
- 1046 E Brame Ave
- 472 S Eshman Ave
- 405 S Eshman Ave
- 835 E Main St
- 861 E Main St
- 829 E Main St
- 137 Martin Luther King Dr
- 26958 E Main St
- 909 E Main St
- 70 Martin Luther King Dr
- 846 E Main St
- 846 E Main St
- 103 Martin Luther King Dr
- 203 Martin Luther King Dr
- 919 E Main St
- 906 E Main St
- 224 Martin Luther King Dr
- 27038 E Main St
- 910 E Main St
- 805 E Main St
- 202 Martin Luther King Dr
- 932 E Main St
- 205 Martin Luther King Dr
Your Personal Tour Guide
Ask me questions while you tour the home.