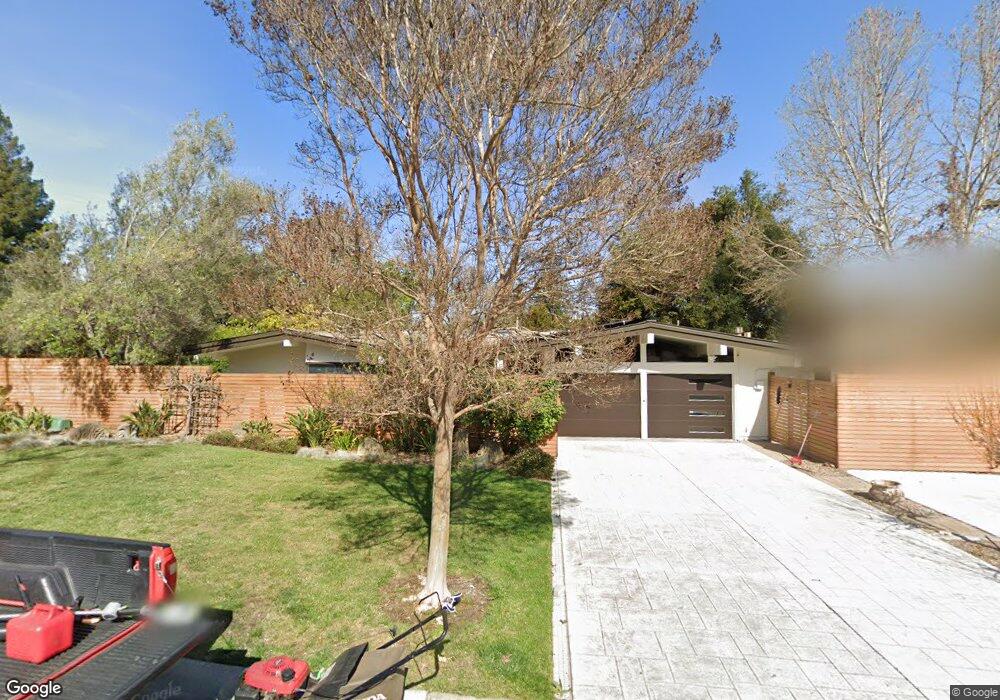
849 Esplanada Way Stanford, CA 94305
Estimated Value: $2,880,000 - $3,385,859
4
Beds
4
Baths
1,731
Sq Ft
$1,858/Sq Ft
Est. Value
About This Home
This home is located at 849 Esplanada Way, Stanford, CA 94305 and is currently estimated at $3,216,965, approximately $1,858 per square foot. 849 Esplanada Way is a home located in Santa Clara County with nearby schools including Escondido Elementary School, Frank S. Greene Jr. Middle, and Palo Alto High School.
Ownership History
Date
Name
Owned For
Owner Type
Purchase Details
Closed on
Jun 14, 2020
Sold by
Hammer Gregory B
Bought by
Gregory B Hammer Trust and Hammer
Current Estimated Value
Purchase Details
Closed on
Aug 8, 2003
Sold by
Pahl Christina
Bought by
Hammer Gregory B
Home Financials for this Owner
Home Financials are based on the most recent Mortgage that was taken out on this home.
Original Mortgage
$1,000,000
Interest Rate
4.5%
Mortgage Type
Purchase Money Mortgage
Purchase Details
Closed on
Apr 22, 1998
Sold by
Naumovski Louie
Bought by
Naumovski Louie and Naumovski Vivi Chan
Home Financials for this Owner
Home Financials are based on the most recent Mortgage that was taken out on this home.
Original Mortgage
$560,000
Interest Rate
7.12%
Purchase Details
Closed on
Jun 14, 1996
Sold by
Schawlow Arthur L and Schawlow Aurelia T
Bought by
Leland Stanford Junior University
Create a Home Valuation Report for This Property
The Home Valuation Report is an in-depth analysis detailing your home's value as well as a comparison with similar homes in the area
Home Values in the Area
Average Home Value in this Area
Purchase History
| Date | Buyer | Sale Price | Title Company |
|---|---|---|---|
| Gregory B Hammer Trust | -- | Roitman Phillip | |
| Hammer Gregory B | -- | Financial Title Company | |
| Naumovski Louie | -- | North American Title Co | |
| Leland Stanford Junior University | -- | First American Title Guarant |
Source: Public Records
Mortgage History
| Date | Status | Borrower | Loan Amount |
|---|---|---|---|
| Previous Owner | Hammer Gregory B | $1,000,000 | |
| Previous Owner | Naumovski Louie | $560,000 |
Source: Public Records
Tax History Compared to Growth
Tax History
| Year | Tax Paid | Tax Assessment Tax Assessment Total Assessment is a certain percentage of the fair market value that is determined by local assessors to be the total taxable value of land and additions on the property. | Land | Improvement |
|---|---|---|---|---|
| 2025 | $28,756 | $2,417,036 | $1,421,789 | $995,247 |
| 2024 | $28,756 | $2,369,644 | $1,393,911 | $975,733 |
| 2023 | $28,323 | $2,323,181 | $1,366,580 | $956,601 |
| 2022 | $27,995 | $2,277,630 | $1,339,785 | $937,845 |
| 2021 | $27,420 | $2,232,971 | $1,313,515 | $919,456 |
| 2020 | $26,766 | $2,210,076 | $1,300,047 | $910,029 |
| 2019 | $26,448 | $2,166,742 | $1,274,556 | $892,186 |
| 2018 | $25,712 | $2,124,258 | $1,249,565 | $874,693 |
| 2017 | $25,246 | $2,082,607 | $1,225,064 | $857,543 |
| 2016 | $24,560 | $2,041,773 | $1,201,044 | $840,729 |
| 2015 | $24,283 | $2,011,105 | $1,183,004 | $828,101 |
| 2014 | $23,764 | $1,971,711 | $1,159,831 | $811,880 |
Source: Public Records
Map
Nearby Homes
- 843 Sonoma Terrace
- 103 Peter Coutts Cir
- 78 Pearce Mitchell Place
- 12 Peter Coutts Cir
- 72 Peter Coutts Cir
- 546 Oxford Ave
- 1630 Portola Ave
- 410 Sheridan Ave Unit 227
- 410 Sheridan Ave Unit 446
- 200 Sheridan Ave Unit 304
- 200 Sheridan Ave Unit 303
- 200 Sheridan Ave Unit 103
- 200 Sheridan Ave Unit 307
- 5 Plan at Acacia
- 4X Plan at Acacia
- 4 Plan at Acacia
- 3 Plan at Acacia
- 2A Plan at Acacia
- 2 Plan at Acacia
- 1 Plan at Acacia
- 845 Esplanada Way
- 853 Esplanada Way
- 848 Pine Hill Rd
- 844 Pine Hill Rd
- 841 Esplanada Way
- 844 Esplanada Way
- 859 Esplanada Way
- 850 Esplanada Way
- 852 Pine Hill Rd
- 856 Esplanada Way
- 860 Esplanada Way
- 835 Esplanada Way
- 836 Pine Hill Rd
- 840 Santa fe Ave
- 838 Esplanada Way
- 831 Esplanada Way
- 841 Pine Hill Rd
- 835 Pine Hill Rd
- 849 Pine Hill Rd
- 838 Santa fe Ave