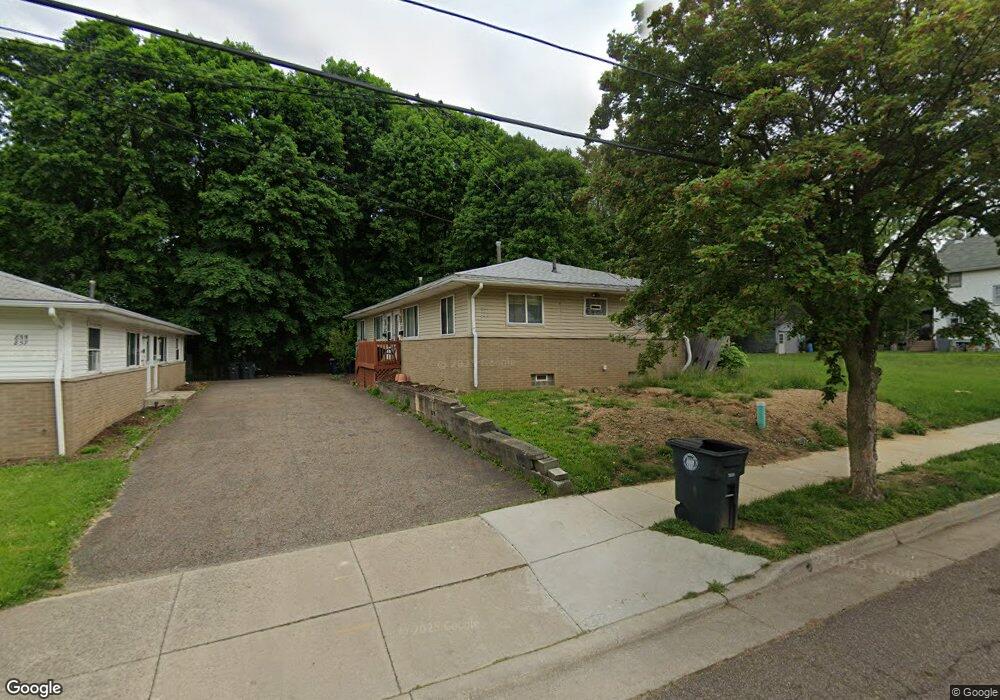
849 Fess Ave Unit 851 Akron, OH 44307
Sherbondy Hill NeighborhoodEstimated Value: $99,000 - $113,000
4
Beds
3
Baths
1,456
Sq Ft
$75/Sq Ft
Est. Value
About This Home
This home is located at 849 Fess Ave Unit 851, Akron, OH 44307 and is currently estimated at $109,309, approximately $75 per square foot. 849 Fess Ave Unit 851 is a home located in Summit County with nearby schools including Emmanuel Christian Academy.
Ownership History
Date
Name
Owned For
Owner Type
Purchase Details
Closed on
Jan 18, 2024
Sold by
Balno Alexander and Balno Austin
Bought by
Srq Investments Llc
Current Estimated Value
Purchase Details
Closed on
Mar 22, 2022
Sold by
Henry Maximilian C
Bought by
Flanary Brendan
Home Financials for this Owner
Home Financials are based on the most recent Mortgage that was taken out on this home.
Original Mortgage
$63,750
Interest Rate
4.16%
Mortgage Type
New Conventional
Purchase Details
Closed on
Jan 5, 2021
Sold by
Henry Residential Holdings Llc
Bought by
Henry Maximilian C
Purchase Details
Closed on
Aug 14, 2019
Sold by
Henry Maximilian C and Henry Maxamilian
Bought by
Henry Residential Holdings Llc
Purchase Details
Closed on
Jun 26, 2018
Sold by
El Elyon Enetrprise Llc
Bought by
Henry Maxamilian
Purchase Details
Closed on
Aug 25, 2010
Sold by
Kimmins Gloria
Bought by
El Elyon Enterprise Llc
Create a Home Valuation Report for This Property
The Home Valuation Report is an in-depth analysis detailing your home's value as well as a comparison with similar homes in the area
Home Values in the Area
Average Home Value in this Area
Purchase History
| Date | Buyer | Sale Price | Title Company |
|---|---|---|---|
| Srq Investments Llc | -- | None Listed On Document | |
| Flanary Brendan | $85,000 | Donofrio Law Llc | |
| Henry Maximilian C | -- | None Available | |
| Henry Residential Holdings Llc | -- | None Available | |
| Henry Maxamilian | $27,000 | Ohio Real Title | |
| El Elyon Enterprise Llc | -- | None Available |
Source: Public Records
Mortgage History
| Date | Status | Borrower | Loan Amount |
|---|---|---|---|
| Previous Owner | Flanary Brendan | $63,750 |
Source: Public Records
Tax History Compared to Growth
Tax History
| Year | Tax Paid | Tax Assessment Tax Assessment Total Assessment is a certain percentage of the fair market value that is determined by local assessors to be the total taxable value of land and additions on the property. | Land | Improvement |
|---|---|---|---|---|
| 2025 | $1,058 | $18,512 | $3,679 | $14,833 |
| 2024 | $1,058 | $18,512 | $3,679 | $14,833 |
| 2023 | $1,058 | $18,512 | $3,679 | $14,833 |
| 2022 | $813 | $10,889 | $2,163 | $8,726 |
| 2021 | $814 | $10,889 | $2,163 | $8,726 |
| 2020 | $803 | $10,890 | $2,160 | $8,730 |
| 2019 | $1,192 | $15,520 | $3,650 | $11,870 |
| 2018 | $1,196 | $15,520 | $3,650 | $11,870 |
| 2017 | $1,309 | $15,520 | $3,650 | $11,870 |
| 2016 | $1,310 | $16,840 | $3,650 | $13,190 |
| 2015 | $1,309 | $16,840 | $3,650 | $13,190 |
| 2014 | $1,299 | $16,840 | $3,650 | $13,190 |
| 2013 | $1,382 | $18,370 | $3,650 | $14,720 |
Source: Public Records
Map
Nearby Homes
- 955 Fess Ave
- 699 Fultz St
- 738 Longview Ave
- 973 Tressel Ave
- 1368 Winton Ave
- 1144 Vernon Odom Blvd
- 776 Krause Ct
- 985 Diana Ave
- 0 East Ave
- 1174 La Croix Ave
- 1132 Bristol Terrace
- 966 La Belle Ave
- 1264 Diagonal Rd
- 1001 Celina Ave
- 1255 Dover Ave
- 737 Vernon Odom Blvd
- 828 Marie Ave
- VL Mercer Ave
- 721 Vernon Odom Blvd
- 1349 Crestview Ave