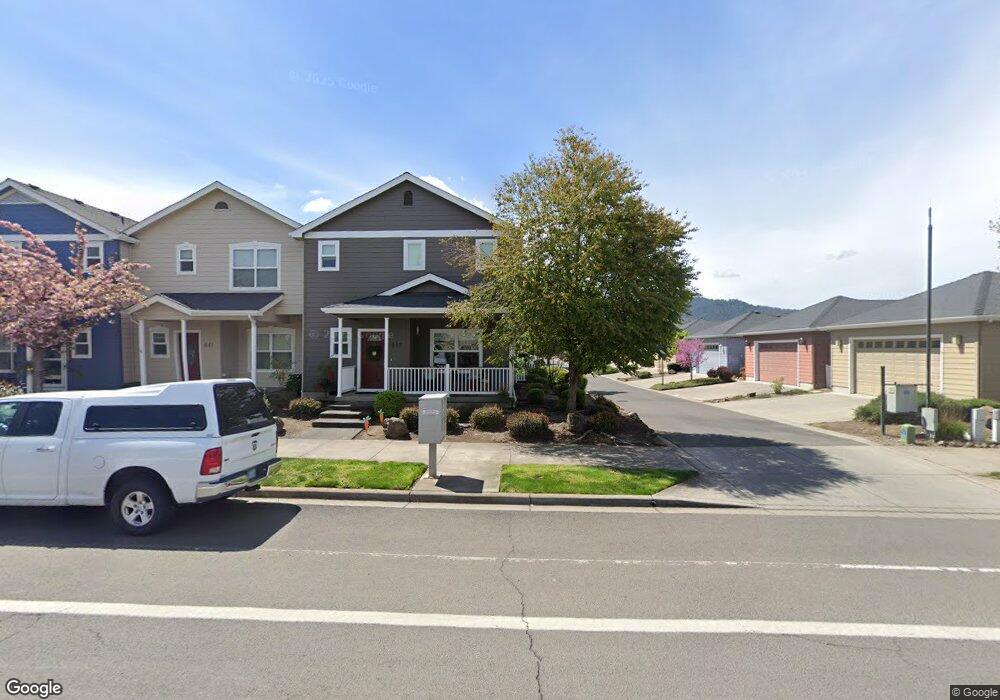
849 N Haskell St Central Point, OR 97502
Estimated Value: $393,768 - $459,000
3
Beds
3
Baths
1,700
Sq Ft
$246/Sq Ft
Est. Value
About This Home
This home is located at 849 N Haskell St, Central Point, OR 97502 and is currently estimated at $418,192, approximately $245 per square foot. 849 N Haskell St is a home located in Jackson County with nearby schools including Richardson Elementary School, Scenic Middle School, and Crater High School.
Ownership History
Date
Name
Owned For
Owner Type
Purchase Details
Closed on
Dec 30, 2019
Sold by
How Brian and How Daina
Bought by
How Daina
Current Estimated Value
Purchase Details
Closed on
Jul 24, 2011
Sold by
How Daina and Arrell Daina L
Bought by
How Brian and How Daina
Home Financials for this Owner
Home Financials are based on the most recent Mortgage that was taken out on this home.
Original Mortgage
$66,025
Interest Rate
4.46%
Mortgage Type
New Conventional
Purchase Details
Closed on
Mar 14, 2006
Sold by
W L Moore Construction Llc
Bought by
Arrell Daina L
Home Financials for this Owner
Home Financials are based on the most recent Mortgage that was taken out on this home.
Original Mortgage
$65,000
Interest Rate
6.19%
Mortgage Type
Purchase Money Mortgage
Create a Home Valuation Report for This Property
The Home Valuation Report is an in-depth analysis detailing your home's value as well as a comparison with similar homes in the area
Purchase History
| Date | Buyer | Sale Price | Title Company |
|---|---|---|---|
| How Daina | -- | None Available | |
| How Brian | -- | First American | |
| Arrell Daina L | $275,679 | Lawyers Title Ins | |
| W L Moore Construction Llc | $70,000 | Lawyers Title Ins |
Source: Public Records
Mortgage History
| Date | Status | Borrower | Loan Amount |
|---|---|---|---|
| Closed | How Brian | $66,025 | |
| Closed | Arrell Daina L | $65,000 |
Source: Public Records
Tax History
| Year | Tax Paid | Tax Assessment Tax Assessment Total Assessment is a certain percentage of the fair market value that is determined by local assessors to be the total taxable value of land and additions on the property. | Land | Improvement |
|---|---|---|---|---|
| 2026 | $4,156 | $251,170 | -- | -- |
| 2025 | $4,054 | $243,860 | $100,990 | $142,870 |
| 2024 | $4,054 | $236,760 | $98,050 | $138,710 |
| 2023 | $3,965 | $229,870 | $95,200 | $134,670 |
| 2022 | $3,832 | $229,870 | $95,200 | $134,670 |
| 2021 | $3,723 | $223,180 | $92,430 | $130,750 |
| 2020 | $3,614 | $216,680 | $89,740 | $126,940 |
| 2019 | $3,525 | $204,250 | $84,590 | $119,660 |
| 2018 | $3,418 | $198,310 | $82,130 | $116,180 |
| 2017 | $3,332 | $198,310 | $82,130 | $116,180 |
| 2016 | $3,235 | $186,940 | $77,420 | $109,520 |
| 2015 | $3,099 | $186,940 | $77,420 | $109,520 |
| 2014 | $3,021 | $176,220 | $72,980 | $103,240 |
Source: Public Records
Map
Nearby Homes
- 659 Blue Moon Dr
- 650 Golden Peak Dr
- 404 Silver Creek Dr
- 0 Boulder Ridge St
- 1134 Steamboat Dr
- 0 N 3rd St
- 342 Hazel St
- 55 Crater Ln
- 4626 N Pacific Hwy
- 545 Bridge Creek Dr
- 1407 Rustler Peak St
- 106 Victoria Way
- 356 Marian Ave Unit 40
- 349 W Pine St
- 144 N 5th St
- 331 N 8th St
- 731 Maple St
- 833 Hazel St
- 209 Corcoran Ln
- 185 Logan Ave
- 841 N Haskell St
- 833 N Haskell St
- 825 N Haskell St
- 505 Blue Moon Dr
- 517 Blue Moon Dr
- 523 Blue Moon Dr
- 817 N Haskell St
- 529 Blue Moon Dr
- 535 Blue Moon Dr
- 801 N Haskell St
- 541 Blue Moon Dr
- 647 Blue Moon Dr
- 508 Blue Moon Dr
- 516 Blue Moon Dr
- 653 Blue Moon Dr
- 530 Blue Moon Dr
- 538 Blue Moon Dr
- 510 Griffin Oaks Dr
- 514 Griffin Oaks Dr
- 506 Griffin Oaks Dr
Your Personal Tour Guide
Ask me questions while you tour the home.