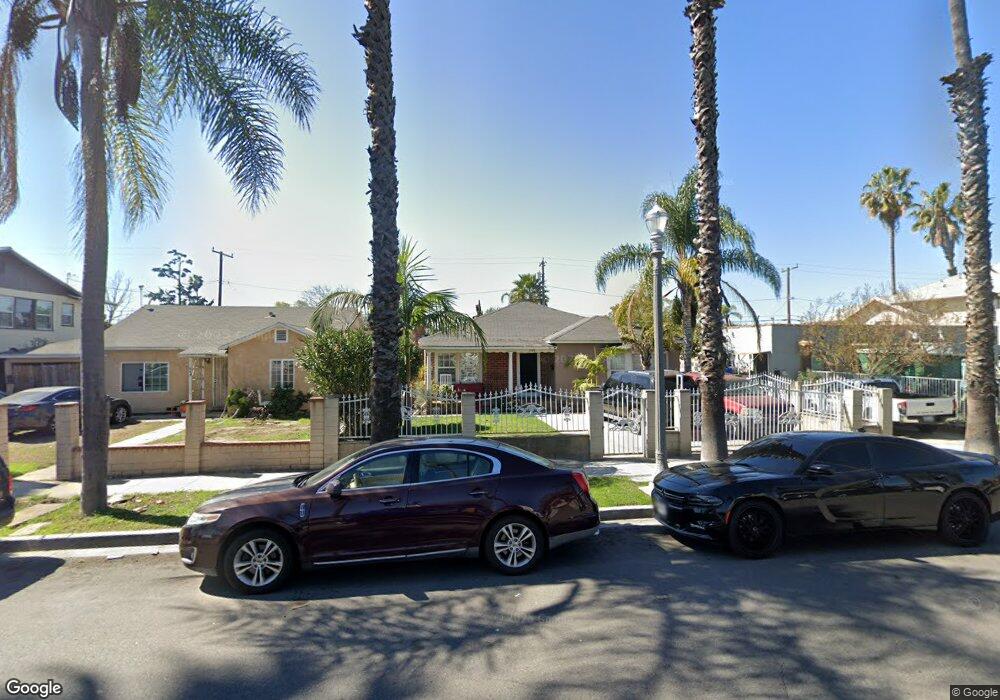
849 N Lemon St Anaheim, CA 92805
North Anaheim NeighborhoodEstimated Value: $842,000 - $892,812
2
Beds
2
Baths
1,492
Sq Ft
$580/Sq Ft
Est. Value
About This Home
This home is located at 849 N Lemon St, Anaheim, CA 92805 and is currently estimated at $865,453, approximately $580 per square foot. 849 N Lemon St is a home located in Orange County with nearby schools including Horace Mann Elementary School, Sycamore Junior High School, and Anaheim High School.
Ownership History
Date
Name
Owned For
Owner Type
Purchase Details
Closed on
Mar 5, 1998
Sold by
Galvez Arturo
Bought by
Gomez Juan Manuel and Gomez Esperanza M
Current Estimated Value
Home Financials for this Owner
Home Financials are based on the most recent Mortgage that was taken out on this home.
Original Mortgage
$133,600
Outstanding Balance
$24,441
Interest Rate
7.02%
Estimated Equity
$841,012
Purchase Details
Closed on
Jun 7, 1994
Sold by
Gomez Santiago
Bought by
Gomez Juan Manuel and Gomez Esperanza M
Purchase Details
Closed on
Jan 6, 1994
Sold by
Gomez Angelina
Bought by
Gomez Santiago
Home Financials for this Owner
Home Financials are based on the most recent Mortgage that was taken out on this home.
Original Mortgage
$156,276
Interest Rate
7.1%
Mortgage Type
FHA
Purchase Details
Closed on
Nov 23, 1993
Sold by
Dighera John J and Dighera Kathleen A
Bought by
Gomez Juan Manuel and Gomez Esperanza M
Home Financials for this Owner
Home Financials are based on the most recent Mortgage that was taken out on this home.
Original Mortgage
$156,276
Interest Rate
7.1%
Mortgage Type
FHA
Create a Home Valuation Report for This Property
The Home Valuation Report is an in-depth analysis detailing your home's value as well as a comparison with similar homes in the area
Home Values in the Area
Average Home Value in this Area
Purchase History
| Date | Buyer | Sale Price | Title Company |
|---|---|---|---|
| Gomez Juan Manuel | -- | -- | |
| Gomez Juan Manuel | -- | -- | |
| Gomez Santiago | -- | Southland Title Corporation | |
| Gomez Juan Manuel | $166,000 | Southland Title Corporation |
Source: Public Records
Mortgage History
| Date | Status | Borrower | Loan Amount |
|---|---|---|---|
| Open | Gomez Juan Manuel | $133,600 | |
| Previous Owner | Gomez Juan Manuel | $156,276 | |
| Closed | Gomez Juan Manuel | $16,700 |
Source: Public Records
Tax History Compared to Growth
Tax History
| Year | Tax Paid | Tax Assessment Tax Assessment Total Assessment is a certain percentage of the fair market value that is determined by local assessors to be the total taxable value of land and additions on the property. | Land | Improvement |
|---|---|---|---|---|
| 2025 | $3,399 | $279,185 | $196,468 | $82,717 |
| 2024 | $3,399 | $273,711 | $192,615 | $81,096 |
| 2023 | $3,325 | $268,345 | $188,839 | $79,506 |
| 2022 | $3,281 | $263,084 | $185,136 | $77,948 |
| 2021 | $3,285 | $257,926 | $181,506 | $76,420 |
| 2020 | $3,270 | $255,282 | $179,645 | $75,637 |
| 2019 | $3,177 | $250,277 | $176,123 | $74,154 |
| 2018 | $3,113 | $245,370 | $172,670 | $72,700 |
| 2017 | $2,994 | $240,559 | $169,284 | $71,275 |
| 2016 | $2,985 | $235,843 | $165,965 | $69,878 |
| 2015 | $2,957 | $232,301 | $163,472 | $68,829 |
| 2014 | $2,781 | $227,751 | $160,270 | $67,481 |
Source: Public Records
Map
Nearby Homes
- 823 N Anaheim Blvd Unit 104
- 1040 N Anaheim Blvd Unit 1
- 625 W La Verne St
- 246 S Cascade Palm Dr
- 1093 N Harbor Blvd
- 243 S Sand Dr
- 1097 N Harbor Blvd
- Plan 1420 at Palm Court
- Plan 1693 at Palm Court
- Plan 1149 at Palm Court
- 1665 W Bamboo Palm Dr
- 1095 N Harbor Blvd
- 509 N Resh Place
- 849 N Lenz Dr
- 700 N Westwood Place
- 602 E Wilhelmina St
- 945 N Summer St
- 917 W Alberta St
- 1125 N Mayfair Ave
- 745 N Vine St
- 845 N Lemon St
- 853 N Lemon St
- 841 N Lemon St
- 848 N Clementine St
- 844 N Clementine St
- 852 N Clementine St
- 837 N Lemon St
- 840 N Clementine St
- 856 N Clementine St
- 846 N Lemon St
- 858 N Lemon St
- 842 N Lemon St
- 836 N Clementine St
- 833 N Lemon St
- 901 N Lemon St
- 838 N Lemon St
- 900 N Lemon St
- 832 N Clementine St
- 900 N Clementine St
- 829 N Lemon St