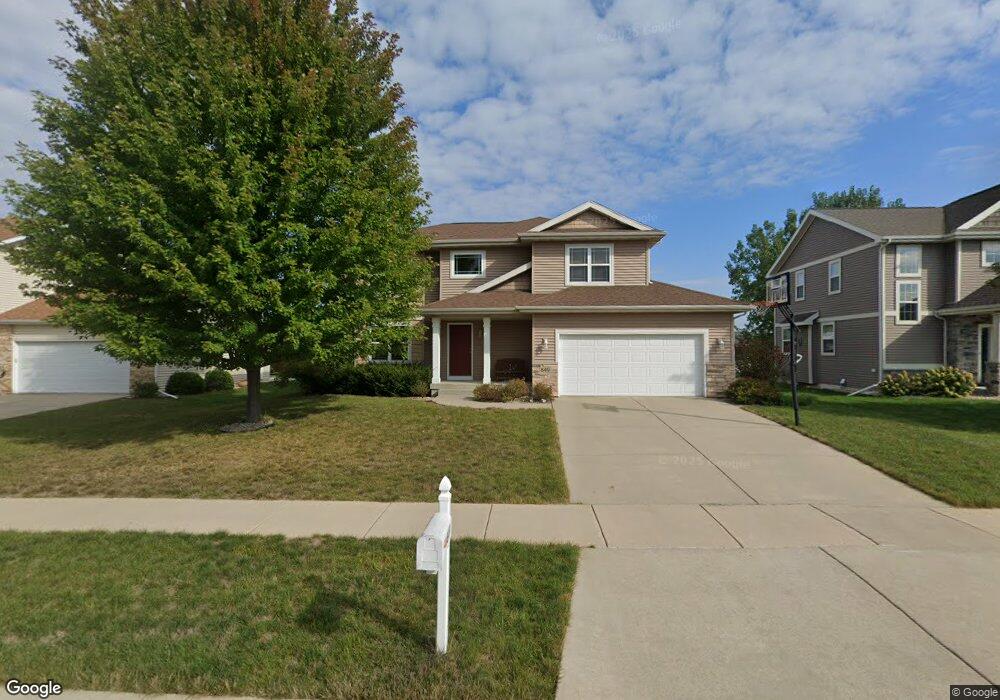
849 Sumac St Oregon, WI 53575
Estimated Value: $487,511 - $607,000
4
Beds
3
Baths
2,124
Sq Ft
$259/Sq Ft
Est. Value
About This Home
This home is located at 849 Sumac St, Oregon, WI 53575 and is currently estimated at $550,128, approximately $259 per square foot. 849 Sumac St is a home located in Dane County with nearby schools including Rome Corners Intermediate School, Oregon Middle School, and Oregon High School.
Ownership History
Date
Name
Owned For
Owner Type
Purchase Details
Closed on
Jun 20, 2008
Sold by
Trademark Homes Llc
Bought by
Mcginty Dennis A and Mcginty Ann
Current Estimated Value
Home Financials for this Owner
Home Financials are based on the most recent Mortgage that was taken out on this home.
Original Mortgage
$185,000
Outstanding Balance
$116,043
Interest Rate
6.04%
Mortgage Type
Purchase Money Mortgage
Estimated Equity
$434,085
Purchase Details
Closed on
Dec 28, 2007
Sold by
Remus Charles and Remus Christine
Bought by
Trademark Homes Llc
Home Financials for this Owner
Home Financials are based on the most recent Mortgage that was taken out on this home.
Original Mortgage
$59,900
Interest Rate
6.27%
Mortgage Type
Purchase Money Mortgage
Purchase Details
Closed on
Mar 30, 2007
Sold by
S & H Properties I Llc
Bought by
Remus Charles and Remus Christine
Create a Home Valuation Report for This Property
The Home Valuation Report is an in-depth analysis detailing your home's value as well as a comparison with similar homes in the area
Home Values in the Area
Average Home Value in this Area
Purchase History
| Date | Buyer | Sale Price | Title Company |
|---|---|---|---|
| Mcginty Dennis A | $285,000 | None Available | |
| Trademark Homes Llc | $59,900 | None Available | |
| Remus Charles | $59,900 | None Available |
Source: Public Records
Mortgage History
| Date | Status | Borrower | Loan Amount |
|---|---|---|---|
| Open | Mcginty Dennis A | $185,000 | |
| Previous Owner | Trademark Homes Llc | $59,900 |
Source: Public Records
Tax History
| Year | Tax Paid | Tax Assessment Tax Assessment Total Assessment is a certain percentage of the fair market value that is determined by local assessors to be the total taxable value of land and additions on the property. | Land | Improvement |
|---|---|---|---|---|
| 2025 | $6,765 | $469,000 | $101,800 | $367,200 |
| 2023 | $7,061 | $447,300 | $81,200 | $366,100 |
| 2022 | $6,806 | $404,700 | $81,200 | $323,500 |
| 2021 | $6,185 | $360,700 | $81,200 | $279,500 |
| 2020 | $6,112 | $341,500 | $81,200 | $260,300 |
| 2019 | $5,942 | $333,200 | $81,200 | $252,000 |
| 2018 | $5,921 | $325,400 | $81,200 | $244,200 |
| 2017 | $5,989 | $319,600 | $68,400 | $251,200 |
| 2016 | $5,855 | $304,300 | $68,400 | $235,900 |
| 2015 | $5,567 | $286,100 | $68,400 | $217,700 |
| 2014 | $5,503 | $283,600 | $68,400 | $215,200 |
| 2013 | $5,434 | $269,700 | $68,400 | $201,300 |
Source: Public Records
Map
Nearby Homes
- 673 Prairie Grass Rd
- 852 Augusta Dr
- 500 Bergamont Blvd
- 130 Jwana Cir
- 375 Alpine Pkwy
- 920 Carnoustie Way
- 639 N Woods Edge Dr
- 924 Brynhill Dr
- 108 Drumlin Cir
- 939 Carnoustie Way
- 310 Ash St
- 156 Hickory Ct
- 137 Lynne Trail
- 655 Cypress Way
- 1232 Tivoli Cir
- L380 Interlachen Ave
- 315 Liberty Park Dr
- 1129 Lincoln Rd
- 387 Liberty Park Dr
- 694 Inverness St
Your Personal Tour Guide
Ask me questions while you tour the home.