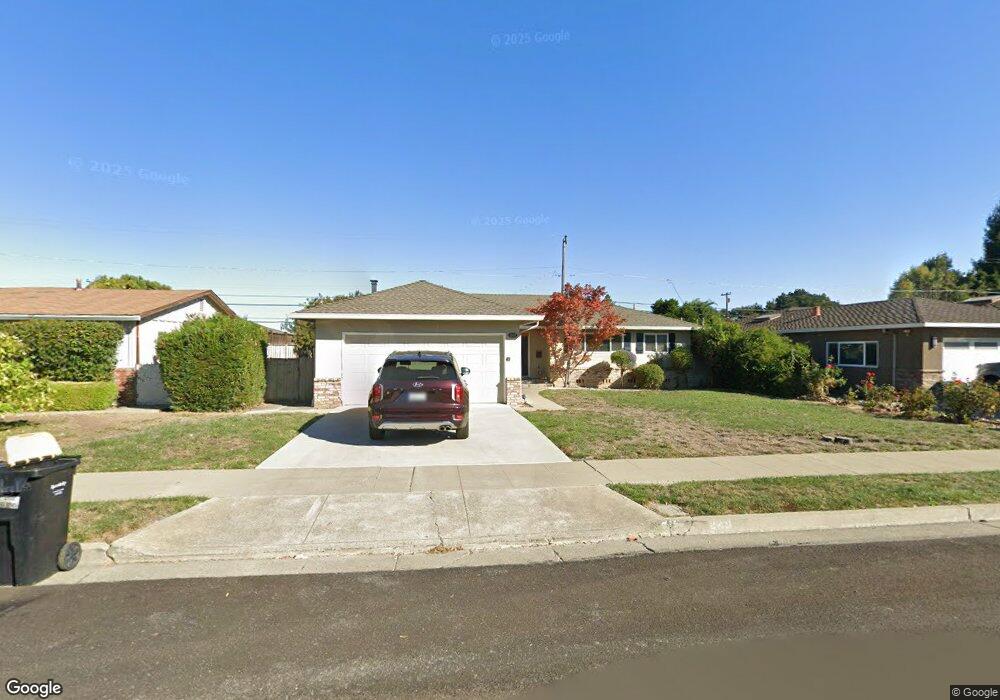
849 Sutter Ave Sunnyvale, CA 94086
Estimated Value: $2,272,000 - $2,863,000
3
Beds
2
Baths
1,201
Sq Ft
$2,088/Sq Ft
Est. Value
About This Home
This home is located at 849 Sutter Ave, Sunnyvale, CA 94086 and is currently estimated at $2,507,984, approximately $2,088 per square foot. 849 Sutter Ave is a home located in Santa Clara County with nearby schools including Cumberland Elementary School, Sunnyvale Middle School, and Homestead High School.
Ownership History
Date
Name
Owned For
Owner Type
Purchase Details
Closed on
Dec 13, 2018
Sold by
Sunkara Srinivas and Sunkara Srinivas S
Bought by
Smith Sunkara Srinivas and Smith Chennu
Current Estimated Value
Purchase Details
Closed on
Jun 5, 2007
Sold by
Spierling Valerie Lynn and Spierling Scott C
Bought by
Sunkara Srinivas S and Chennu Smitha
Home Financials for this Owner
Home Financials are based on the most recent Mortgage that was taken out on this home.
Original Mortgage
$52,000
Outstanding Balance
$31,767
Interest Rate
6.16%
Mortgage Type
Credit Line Revolving
Estimated Equity
$2,476,217
Purchase Details
Closed on
Mar 23, 2007
Sold by
Adams Robert T
Bought by
Spierling Scott C and Spierling Valerie Lynn
Home Financials for this Owner
Home Financials are based on the most recent Mortgage that was taken out on this home.
Original Mortgage
$64,200
Interest Rate
6.13%
Mortgage Type
Stand Alone Second
Create a Home Valuation Report for This Property
The Home Valuation Report is an in-depth analysis detailing your home's value as well as a comparison with similar homes in the area
Purchase History
| Date | Buyer | Sale Price | Title Company |
|---|---|---|---|
| Smith Sunkara Srinivas | -- | None Available | |
| Sunkara Srinivas S | $891,500 | Old Republic Title Company | |
| Spierling Scott C | $642,000 | Old Republic Title Company |
Source: Public Records
Mortgage History
| Date | Status | Borrower | Loan Amount |
|---|---|---|---|
| Open | Sunkara Srinivas S | $52,000 | |
| Open | Sunkara Srinivas S | $712,000 | |
| Previous Owner | Spierling Scott C | $64,200 | |
| Previous Owner | Spierling Scott C | $513,600 |
Source: Public Records
Tax History
| Year | Tax Paid | Tax Assessment Tax Assessment Total Assessment is a certain percentage of the fair market value that is determined by local assessors to be the total taxable value of land and additions on the property. | Land | Improvement |
|---|---|---|---|---|
| 2025 | $13,766 | $1,194,307 | $1,004,835 | $189,472 |
| 2024 | $13,766 | $1,170,890 | $985,133 | $185,757 |
| 2023 | $13,640 | $1,147,932 | $965,817 | $182,115 |
| 2022 | $13,426 | $1,125,425 | $946,880 | $178,545 |
| 2021 | $13,300 | $1,103,359 | $928,314 | $175,045 |
| 2020 | $13,132 | $1,092,047 | $918,796 | $173,251 |
| 2019 | $12,757 | $1,070,635 | $900,781 | $169,854 |
| 2018 | $12,502 | $1,049,643 | $883,119 | $166,524 |
| 2017 | $12,340 | $1,029,062 | $865,803 | $163,259 |
| 2016 | $11,862 | $1,008,885 | $848,827 | $160,058 |
| 2015 | $11,930 | $993,731 | $836,077 | $157,654 |
| 2014 | $9,535 | $792,000 | $666,400 | $125,600 |
Source: Public Records
Map
Nearby Homes
- 486 Peralta Ave
- 606 W Mc Kinley Ave
- 715 Quetta Ave Unit B
- 538 S Mathilda Ave Unit 301
- 225 S Mathilda Ave
- 709 Satsuma Terrace
- 839 Coolidge Ave
- 745 Reseda Dr
- 560 Holthouse Terrace
- 559 S Taaffe St
- 508 Holthouse Terrace
- 119 Florence St
- 806 Piper Ave
- 850 Quetta Ave
- 320 Angel Ave
- 992 Alpine Terrace Unit 5
- 992 Alpine Terrace Unit 6
- 388 Beemer Ave
- 384 Beemer Ave
- 845 Groton Ct
- 845 Sutter Ave
- 853 Sutter Ave
- 834 W Iowa Ave
- 838 W Iowa Ave
- 830 W Iowa Ave
- 842 W Iowa Ave
- 857 Sutter Ave
- 839 Sutter Ave
- 850 Sutter Ave
- 826 W Iowa Ave
- 409 Rincon Ave
- 846 W Iowa Ave
- 861 Sutter Ave
- 822 W Iowa Ave
- 418 Purisima Ave
- 833 Sutter Ave
- 850 W Iowa Ave
- 413 Rincon Ave
- 401 Purisima Ave
- 818 W Iowa Ave
Your Personal Tour Guide
Ask me questions while you tour the home.