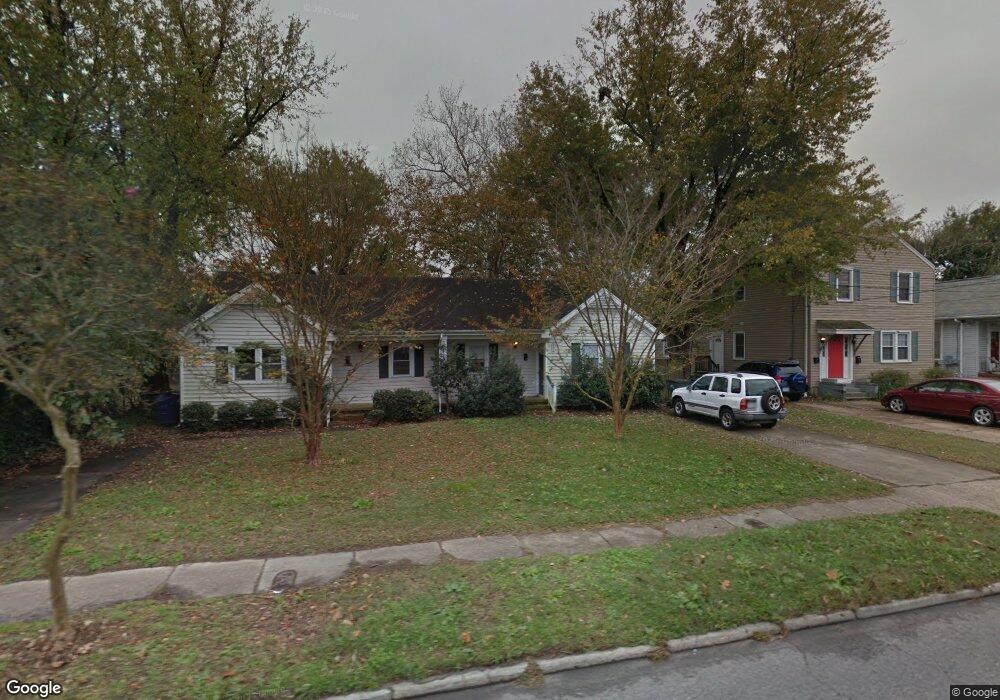
849 W 38th St Unit B Norfolk, VA 23508
Park Place NeighborhoodEstimated Value: $188,000 - $251,000
3
Beds
2
Baths
1,027
Sq Ft
$209/Sq Ft
Est. Value
About This Home
This home is located at 849 W 38th St Unit B, Norfolk, VA 23508 and is currently estimated at $214,756, approximately $209 per square foot. 849 W 38th St Unit B is a home located in Norfolk City with nearby schools including James Monroe Elementary School, Blair Middle School, and Maury High School.
Ownership History
Date
Name
Owned For
Owner Type
Purchase Details
Closed on
Jun 20, 2018
Sold by
Sleiman Marcelo
Bought by
Celin Jenny
Current Estimated Value
Home Financials for this Owner
Home Financials are based on the most recent Mortgage that was taken out on this home.
Original Mortgage
$161,500
Outstanding Balance
$139,983
Interest Rate
4.6%
Mortgage Type
New Conventional
Estimated Equity
$74,773
Purchase Details
Closed on
Oct 31, 2017
Sold by
Hsbc Bank Usa National Association
Bought by
Sleiman Marcelo
Purchase Details
Closed on
Jun 13, 2017
Sold by
Canadiate Chaton L and Canadiate Linda A
Bought by
Hsbc Bank Usa National Associations and Merrill Lynch Mortgage Investors Inc Mor
Purchase Details
Closed on
Aug 1, 2006
Sold by
King Foy M
Bought by
Canadiate Chaton L and Canadiate Linda A
Home Financials for this Owner
Home Financials are based on the most recent Mortgage that was taken out on this home.
Original Mortgage
$35,980
Interest Rate
6.83%
Mortgage Type
Stand Alone Second
Create a Home Valuation Report for This Property
The Home Valuation Report is an in-depth analysis detailing your home's value as well as a comparison with similar homes in the area
Home Values in the Area
Average Home Value in this Area
Purchase History
| Date | Buyer | Sale Price | Title Company |
|---|---|---|---|
| Celin Jenny | $170,000 | True North Title | |
| Sleiman Marcelo | $42,000 | Premium Title Svcs Va Inc | |
| Hsbc Bank Usa National Associations | $162,521 | Attorney | |
| Canadiate Chaton L | $179,900 | -- |
Source: Public Records
Mortgage History
| Date | Status | Borrower | Loan Amount |
|---|---|---|---|
| Open | Celin Jenny | $161,500 | |
| Previous Owner | Canadiate Chaton L | $35,980 | |
| Previous Owner | Canadiate Chaton L | $143,920 |
Source: Public Records
Tax History Compared to Growth
Tax History
| Year | Tax Paid | Tax Assessment Tax Assessment Total Assessment is a certain percentage of the fair market value that is determined by local assessors to be the total taxable value of land and additions on the property. | Land | Improvement |
|---|---|---|---|---|
| 2025 | $2,858 | $228,600 | $32,800 | $195,800 |
| 2024 | $2,497 | $203,000 | $32,800 | $170,200 |
| 2023 | $2,408 | $192,600 | $28,700 | $163,900 |
| 2022 | $2,213 | $177,000 | $28,700 | $148,300 |
| 2021 | $2,093 | $167,400 | $28,700 | $138,700 |
| 2020 | $2,041 | $163,300 | $24,600 | $138,700 |
| 2019 | $2,041 | $163,300 | $24,600 | $138,700 |
| 2018 | $1,883 | $150,600 | $24,600 | $126,000 |
| 2017 | $1,747 | $151,900 | $24,600 | $127,300 |
| 2016 | $1,834 | $167,400 | $24,300 | $143,100 |
| 2015 | $1,915 | $167,400 | $24,300 | $143,100 |
| 2014 | $1,915 | $167,400 | $24,300 | $143,100 |
Source: Public Records
Map
Nearby Homes
- 832 W 37th St
- 823 W 41st St
- 3706 Colley Ave Unit A
- 1013 W 36th St
- 1043 W 37th St
- 831 W 35th St
- 852 W 42nd St
- 1043 W 36th St
- 719 Michigan Ave
- 714 Michigan Ave
- 710 W 37th St
- 1042 W 35th St
- 717 W 29th St
- 3615 Newport Ave
- 611 Carolina Ave
- 625 W 34th St
- 1231 W 27th St
- 609 Virginia Ave
- 4107 Newport Ave
- 533 W 36th St Unit 304