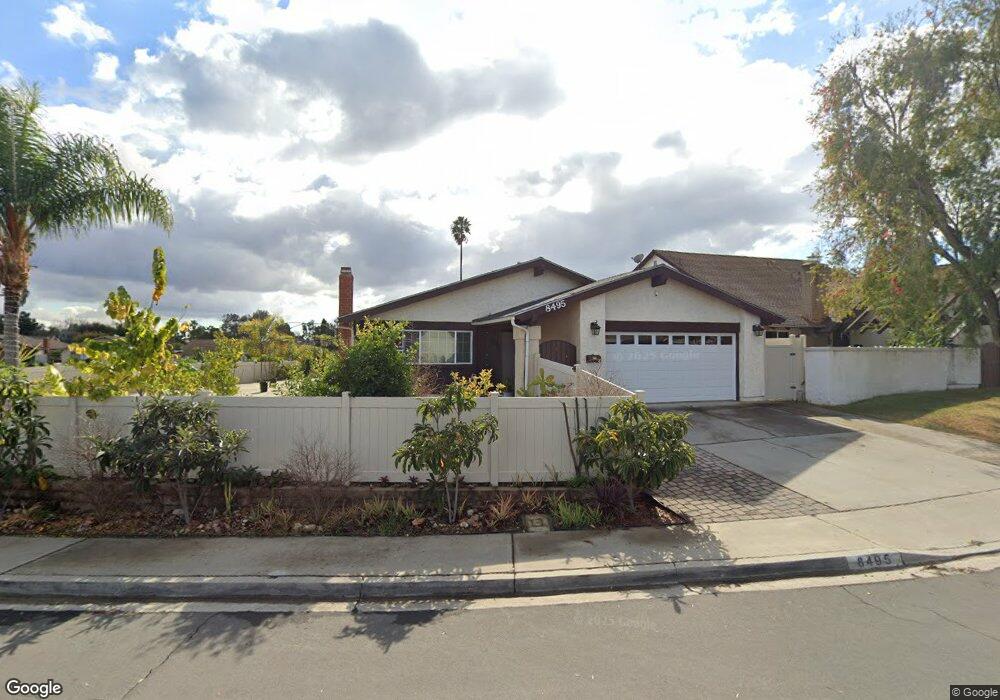
8495 Pallux Way San Diego, CA 92126
Mira Mesa NeighborhoodEstimated Value: $1,022,000 - $1,093,000
3
Beds
2
Baths
1,405
Sq Ft
$750/Sq Ft
Est. Value
About This Home
This home is located at 8495 Pallux Way, San Diego, CA 92126 and is currently estimated at $1,054,318, approximately $750 per square foot. 8495 Pallux Way is a home located in San Diego County with nearby schools including Ericson Elementary School, Wangenheim Middle School, and Mira Mesa High School.
Ownership History
Date
Name
Owned For
Owner Type
Purchase Details
Closed on
May 16, 2007
Sold by
Vuong Muoi
Bought by
Tong Ho Jack
Current Estimated Value
Home Financials for this Owner
Home Financials are based on the most recent Mortgage that was taken out on this home.
Original Mortgage
$413,250
Outstanding Balance
$250,681
Interest Rate
6.12%
Mortgage Type
Purchase Money Mortgage
Estimated Equity
$803,637
Purchase Details
Closed on
May 11, 2007
Sold by
Tong Ho Jack and Tong Alice
Bought by
Nakha Peter K and Nakha Kate N
Home Financials for this Owner
Home Financials are based on the most recent Mortgage that was taken out on this home.
Original Mortgage
$413,250
Outstanding Balance
$250,681
Interest Rate
6.12%
Mortgage Type
Purchase Money Mortgage
Estimated Equity
$803,637
Purchase Details
Closed on
Aug 22, 2001
Sold by
Tong Alice and Tong Ho Jack
Bought by
Tong Alice and Alice Tong Living Trust
Purchase Details
Closed on
Mar 12, 1985
Create a Home Valuation Report for This Property
The Home Valuation Report is an in-depth analysis detailing your home's value as well as a comparison with similar homes in the area
Home Values in the Area
Average Home Value in this Area
Purchase History
| Date | Buyer | Sale Price | Title Company |
|---|---|---|---|
| Tong Ho Jack | -- | New Century Title Company | |
| Nakha Peter K | $435,000 | New Century Title Company | |
| Tong Alice | -- | -- | |
| -- | $107,000 | -- |
Source: Public Records
Mortgage History
| Date | Status | Borrower | Loan Amount |
|---|---|---|---|
| Open | Nakha Peter K | $413,250 |
Source: Public Records
Tax History Compared to Growth
Tax History
| Year | Tax Paid | Tax Assessment Tax Assessment Total Assessment is a certain percentage of the fair market value that is determined by local assessors to be the total taxable value of land and additions on the property. | Land | Improvement |
|---|---|---|---|---|
| 2025 | $6,983 | $582,781 | $381,821 | $200,960 |
| 2024 | $6,983 | $571,355 | $374,335 | $197,020 |
| 2023 | $6,827 | $560,153 | $366,996 | $193,157 |
| 2022 | $6,643 | $549,170 | $359,800 | $189,370 |
| 2021 | $6,596 | $538,403 | $352,746 | $185,657 |
| 2020 | $6,515 | $532,884 | $349,130 | $183,754 |
| 2019 | $6,397 | $522,436 | $342,285 | $180,151 |
| 2018 | $5,980 | $512,193 | $335,574 | $176,619 |
| 2017 | $5,833 | $502,151 | $328,995 | $173,156 |
| 2016 | $5,739 | $492,306 | $322,545 | $169,761 |
| 2015 | $5,478 | $470,000 | $381,000 | $89,000 |
| 2014 | $4,910 | $420,000 | $341,000 | $79,000 |
Source: Public Records
Map
Nearby Homes
- 8468 Calle Morelos
- 8324 Calle Calzada
- 8393 Capricorn Way Unit 90
- 8446 Summerdale Rd Unit D
- 8388 Summerdale Rd Unit B
- 8446 Summerdale Rd Unit A
- 11161 Camino Ruiz Unit 44
- 8595 Summerdale Rd Unit 170
- 8686 Perseus Rd
- 8485 Westmore Rd Unit 40
- 8479 Westmore Rd Unit 55
- 10948 Worthing Ave
- 8365 Westmore Rd Unit 20
- 10855 Camino Ruiz Unit 48
- 10875 Camino Ruiz Unit 50
- 11313 Zapata Ave Unit 6
- 8488 New Salem St
- 8476 New Salem St Unit 77
- 8378 New Salem St Unit 24
- 11336 Camarosa Cir
- 8487 Pallux Way
- 11042 Sagittarius Rd Unit 5
- 8479 Pallux Way
- 8488 Pallux Way
- 8494 Pallux Way
- 8482 Pallux Way
- 11034 Sagittarius Rd
- 8476 Pallux Way
- 8471 Pallux Way Unit 5
- 8491 Borealis Rd
- 8470 Pallux Way
- 11069 Sagittarius Rd
- 11066 Sagittarius Rd
- 11026 Sagittarius Rd
- 8466 Pallux Way
- 11029 Sagittarius Rd
- 8485 Borealis Rd
- 8471 Aries Rd
- 11075 Sagittarius Rd
- 8475 Aries Rd