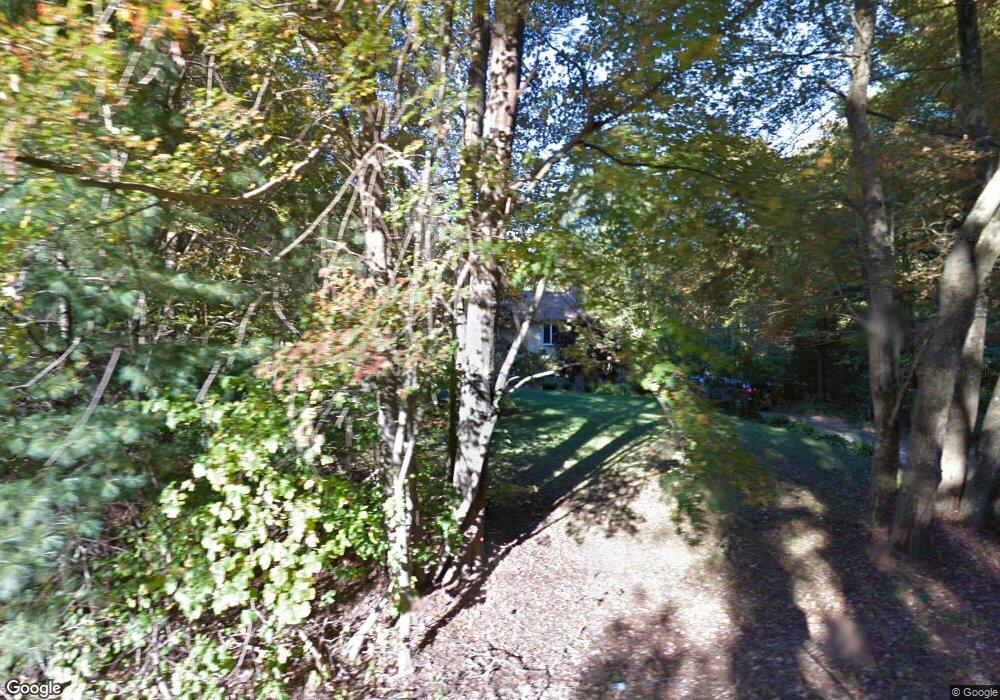
85 Balcom St Mansfield, MA 02048
Estimated Value: $585,285 - $714,000
3
Beds
2
Baths
1,132
Sq Ft
$576/Sq Ft
Est. Value
About This Home
This home is located at 85 Balcom St, Mansfield, MA 02048 and is currently estimated at $652,071, approximately $576 per square foot. 85 Balcom St is a home located in Bristol County with nearby schools including Everett W. Robinson Elementary School, Jordan/Jackson Elementary School, and Harold L. Qualters Middle School.
Ownership History
Date
Name
Owned For
Owner Type
Purchase Details
Closed on
Sep 30, 1999
Sold by
Guilfoy John P and Guilfoy Marie
Bought by
Ricci Joseph J and Ricci Gail B
Current Estimated Value
Create a Home Valuation Report for This Property
The Home Valuation Report is an in-depth analysis detailing your home's value as well as a comparison with similar homes in the area
Home Values in the Area
Average Home Value in this Area
Purchase History
| Date | Buyer | Sale Price | Title Company |
|---|---|---|---|
| Ricci Joseph J | $199,000 | -- |
Source: Public Records
Mortgage History
| Date | Status | Borrower | Loan Amount |
|---|---|---|---|
| Open | Ricci Joseph J | $75,000 | |
| Open | Ricci Joseph J | $155,000 |
Source: Public Records
Tax History
| Year | Tax Paid | Tax Assessment Tax Assessment Total Assessment is a certain percentage of the fair market value that is determined by local assessors to be the total taxable value of land and additions on the property. | Land | Improvement |
|---|---|---|---|---|
| 2025 | $6,851 | $520,200 | $241,800 | $278,400 |
| 2024 | $6,356 | $470,800 | $241,800 | $229,000 |
| 2023 | $6,226 | $441,900 | $241,800 | $200,100 |
| 2022 | $6,038 | $398,000 | $223,800 | $174,200 |
| 2021 | $5,651 | $367,900 | $195,900 | $172,000 |
| 2020 | $5,576 | $363,000 | $186,600 | $176,400 |
| 2019 | $5,208 | $342,200 | $155,400 | $186,800 |
| 2018 | $5,026 | $322,800 | $148,200 | $174,600 |
| 2017 | $4,833 | $321,800 | $144,000 | $177,800 |
| 2016 | $4,780 | $310,200 | $137,100 | $173,100 |
| 2015 | $4,442 | $286,600 | $137,100 | $149,500 |
Source: Public Records
Map
Nearby Homes
- 14 Claire Ave
- 44 Surrey Dr
- 85 Jewell St
- 150 Gilbert St
- 2 Oak St Unit 2B
- 128 Tremont St
- 451R Gilbert St
- 24 Maverick Dr
- 1769 West St
- 49 Pheasant Hill Rd
- 71 Richardson Ave
- 250 Mansfield Ave Unit 11
- 17 Childs Ln
- 25 Shepherd St
- 343 Godfrey Dr
- 143 Oak St Unit 10
- 101 Godfrey Dr Unit 101
- 10 Walter St
- 115 Westfield Dr
- 25 Munroe Dr
Your Personal Tour Guide
Ask me questions while you tour the home.