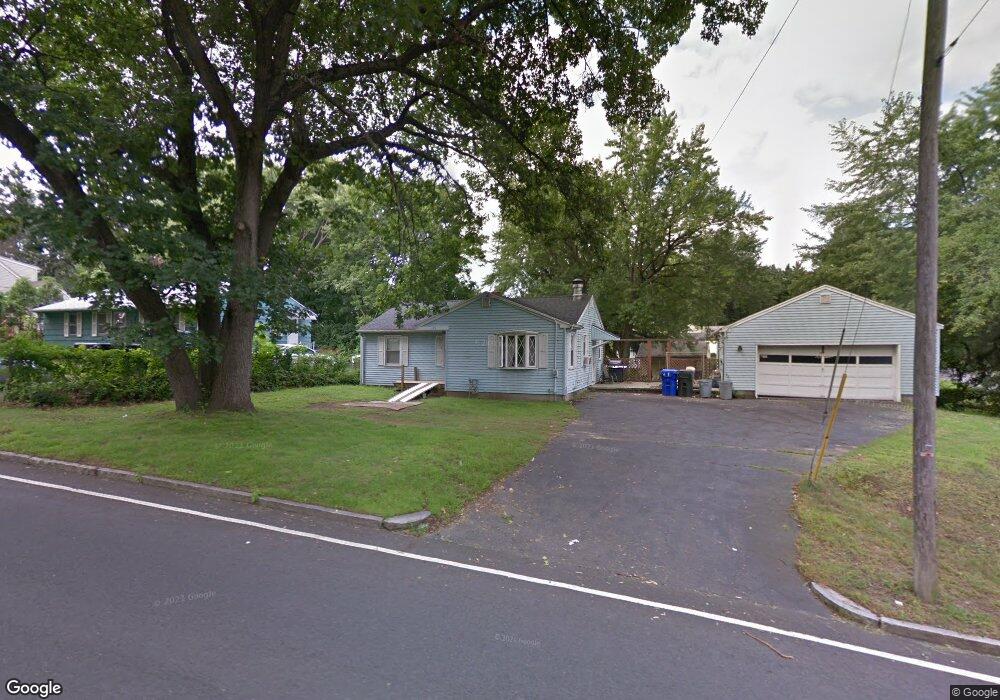
85 Bircham St Springfield, MA 01104
East Springfield NeighborhoodEstimated Value: $210,000 - $248,000
3
Beds
1
Bath
894
Sq Ft
$253/Sq Ft
Est. Value
About This Home
This home is located at 85 Bircham St, Springfield, MA 01104 and is currently estimated at $226,071, approximately $252 per square foot. 85 Bircham St is a home located in Hampden County with nearby schools including Daniel B Brunton, John F. Kennedy Academy, and Springfield Central High School.
Ownership History
Date
Name
Owned For
Owner Type
Purchase Details
Closed on
Dec 23, 2019
Sold by
Pellerin Ronald E
Bought by
Pellerin Patricia A
Current Estimated Value
Purchase Details
Closed on
Aug 2, 1977
Bought by
Pellerin Ronald E and Pellerin Patricia Ann
Create a Home Valuation Report for This Property
The Home Valuation Report is an in-depth analysis detailing your home's value as well as a comparison with similar homes in the area
Home Values in the Area
Average Home Value in this Area
Purchase History
| Date | Buyer | Sale Price | Title Company |
|---|---|---|---|
| Pellerin Patricia A | -- | None Available | |
| Pellerin Ronald E | $28,500 | -- |
Source: Public Records
Mortgage History
| Date | Status | Borrower | Loan Amount |
|---|---|---|---|
| Previous Owner | Pellerin Ronald E | $90,435 | |
| Previous Owner | Pellerin Ronald E | $35,250 | |
| Previous Owner | Pellerin Ronald E | $30,500 |
Source: Public Records
Tax History
| Year | Tax Paid | Tax Assessment Tax Assessment Total Assessment is a certain percentage of the fair market value that is determined by local assessors to be the total taxable value of land and additions on the property. | Land | Improvement |
|---|---|---|---|---|
| 2025 | $3,033 | $193,400 | $38,700 | $154,700 |
| 2024 | $3,063 | $190,700 | $38,700 | $152,000 |
| 2023 | $3,214 | $188,500 | $36,100 | $152,400 |
| 2022 | $3,007 | $159,800 | $33,700 | $126,100 |
| 2021 | $2,659 | $140,700 | $30,700 | $110,000 |
| 2020 | $2,490 | $127,500 | $30,700 | $96,800 |
| 2019 | $2,293 | $116,500 | $31,700 | $84,800 |
| 2018 | $2,350 | $119,400 | $31,700 | $87,700 |
| 2017 | $2,383 | $121,200 | $28,700 | $92,500 |
| 2016 | $2,188 | $111,300 | $28,700 | $82,600 |
| 2015 | $2,288 | $116,300 | $28,700 | $87,600 |
Source: Public Records
Map
Nearby Homes
- 294 Tremont St
- 93 Grochmal Ave Unit 12
- 83 Oakdale St
- 4 Seneca St
- 28 Mockingbird Dr
- 19 Emily St
- 66 Bromont St
- 147 Bowles Park
- 108 Barre St
- 1289 Bay St
- 1045-1047 Worcester St
- 251 Edendale St
- 543 Boston Rd
- 225 Osborne Terrace
- 59 Prospect Gardens
- 181 Marsden St
- 140 Cardinal St
- 58 Eureka St
- 83 Loomis Dr
- - Glenwood St
Your Personal Tour Guide
Ask me questions while you tour the home.