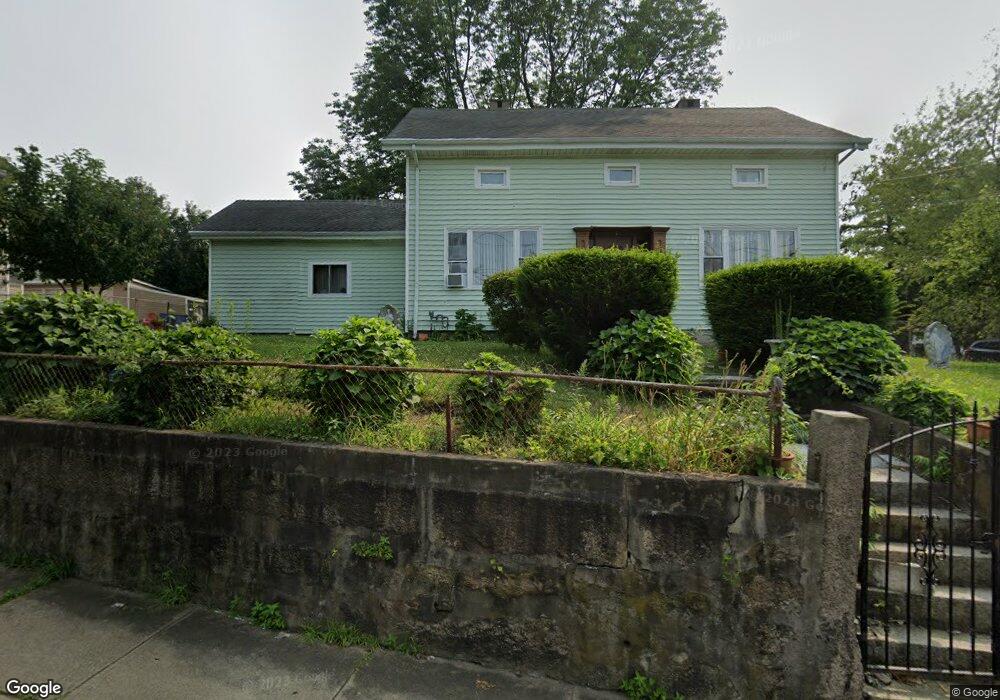
85 Chace St Fall River, MA 02724
Sandy Beach NeighborhoodEstimated Value: $383,000 - $534,000
4
Beds
1
Bath
1,710
Sq Ft
$256/Sq Ft
Est. Value
About This Home
This home is located at 85 Chace St, Fall River, MA 02724 and is currently estimated at $438,288, approximately $256 per square foot. 85 Chace St is a home located in Bristol County with nearby schools including Carlton M. Viveiros Elementary School, Matthew J. Kuss Middle School, and B M C Durfee High School.
Ownership History
Date
Name
Owned For
Owner Type
Purchase Details
Closed on
Jul 1, 2014
Sold by
Cerqueira Amadeu and Cerqueira Maria
Bought by
Cerqueira Amadeu and Cerqueira Maria R
Current Estimated Value
Purchase Details
Closed on
May 27, 1981
Bought by
Cerqueira Amadeu and Cerqueira Maria R
Create a Home Valuation Report for This Property
The Home Valuation Report is an in-depth analysis detailing your home's value as well as a comparison with similar homes in the area
Home Values in the Area
Average Home Value in this Area
Purchase History
| Date | Buyer | Sale Price | Title Company |
|---|---|---|---|
| Cerqueira Amadeu | -- | -- | |
| Cerqueira Amadeu | $20,000 | -- |
Source: Public Records
Mortgage History
| Date | Status | Borrower | Loan Amount |
|---|---|---|---|
| Previous Owner | Cerqueira Amadeu | $9,200 |
Source: Public Records
Tax History Compared to Growth
Tax History
| Year | Tax Paid | Tax Assessment Tax Assessment Total Assessment is a certain percentage of the fair market value that is determined by local assessors to be the total taxable value of land and additions on the property. | Land | Improvement |
|---|---|---|---|---|
| 2025 | $3,725 | $325,300 | $118,600 | $206,700 |
| 2024 | $3,507 | $305,200 | $114,200 | $191,000 |
| 2023 | $3,222 | $262,600 | $94,400 | $168,200 |
| 2022 | $3,014 | $238,800 | $89,900 | $148,900 |
| 2021 | $2,820 | $203,900 | $85,500 | $118,400 |
| 2020 | $2,857 | $197,700 | $84,300 | $113,400 |
| 2019 | $2,744 | $188,200 | $81,100 | $107,100 |
| 2018 | $2,632 | $180,000 | $87,900 | $92,100 |
| 2017 | $2,451 | $175,100 | $83,800 | $91,300 |
| 2016 | $2,393 | $175,600 | $89,100 | $86,500 |
| 2015 | $2,297 | $175,600 | $89,100 | $86,500 |
| 2014 | $2,176 | $173,000 | $86,500 | $86,500 |
Source: Public Records
Map
Nearby Homes
- 76 Church St
- 24 Hall St
- 20 Wilcox St
- 27 Vista Way
- 321 King St
- 636-644 Dwelly St
- 245 Dwelly St
- 484 S Beach St
- 1334 S Main St
- 1273-1279 S Main St
- 11 Palmer St
- 644-648 King Philip St
- 609 King Philip St
- 310 King Philip St
- 1175 S Main St
- 1173 S Main St
- 1846 S Main St
- 1852 S Main St
- 234 Kilburn St
- 917 Dwelly St