Estimated Value: $545,000 - $734,000
3
Beds
3
Baths
1,568
Sq Ft
$398/Sq Ft
Est. Value
About This Home
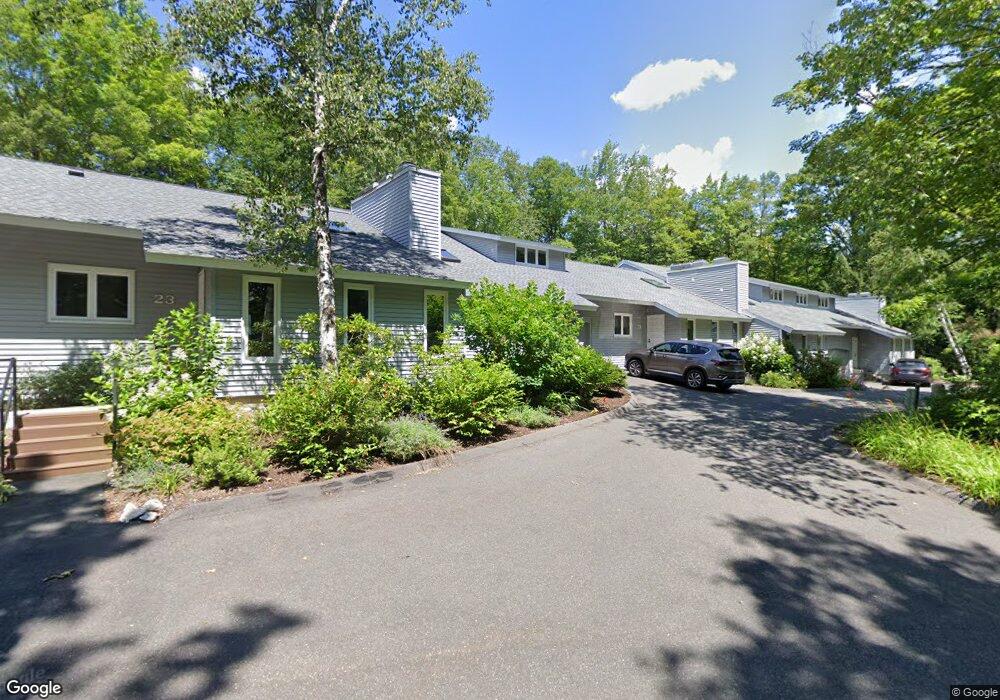
This home is located at 85 Clifden Ct Unit 42, Lenox, MA 01240 and is currently estimated at $624,100, approximately $398 per square foot. 85 Clifden Ct Unit 42 is a home located in Berkshire County with nearby schools including Morris Elementary School, Lenox Memorial High School, and The Montessori School of the Berkshires.
Ownership History
Date
Name
Owned For
Owner Type
Purchase Details
Closed on
Jun 25, 2020
Sold by
Li Huaziang and Li Huaxiang
Bought by
Brown Lewis I
Current Estimated Value
Purchase Details
Closed on
Nov 6, 2015
Sold by
85 Clifden Court 20 Nt
Bought by
Zhou Min and Li Huaxiang
Purchase Details
Closed on
Oct 20, 2014
Sold by
85 Clifden Ct Nt
Bought by
Hock Howard S and Hock Susan R
Purchase Details
Closed on
Jul 22, 2004
Sold by
Hittleman Sandra
Bought by
85 Clifden Ct Unit 20
Purchase Details
Closed on
May 16, 2003
Sold by
Crane Lansing E
Bought by
Hittleman Sandra
Purchase Details
Closed on
Mar 1, 2000
Sold by
Kent Howard and Kent Marcia J
Bought by
Crane Lansing E
Home Financials for this Owner
Home Financials are based on the most recent Mortgage that was taken out on this home.
Original Mortgage
$195,000
Interest Rate
8.21%
Mortgage Type
Purchase Money Mortgage
Purchase Details
Closed on
Mar 11, 1998
Sold by
Winden Hill Nt and Aaronson Harris N
Bought by
Hittleman Sandra
Purchase Details
Closed on
Sep 18, 1992
Sold by
Hirt R Paul and Campana-Hirt Lynn
Bought by
Kent Howard and Kent Marcia J
Create a Home Valuation Report for This Property
The Home Valuation Report is an in-depth analysis detailing your home's value as well as a comparison with similar homes in the area
Home Values in the Area
Average Home Value in this Area
Purchase History
| Date | Buyer | Sale Price | Title Company |
|---|---|---|---|
| Brown Lewis I | $342,000 | None Available | |
| Zhou Min | $335,000 | -- | |
| Hock Howard S | $332,000 | -- | |
| 85 Clifden Ct Unit 20 | $405,000 | -- | |
| Hittleman Sandra | $349,000 | -- | |
| Crane Lansing E | $260,000 | -- | |
| Hittleman Sandra | $173,000 | -- | |
| Kent Howard | $200,000 | -- |
Source: Public Records
Mortgage History
| Date | Status | Borrower | Loan Amount |
|---|---|---|---|
| Previous Owner | Kent Howard | $195,000 |
Source: Public Records
Tax History
| Year | Tax Paid | Tax Assessment Tax Assessment Total Assessment is a certain percentage of the fair market value that is determined by local assessors to be the total taxable value of land and additions on the property. | Land | Improvement |
|---|---|---|---|---|
| 2025 | $4,534 | $501,000 | $0 | $501,000 |
| 2024 | $3,964 | $437,100 | $0 | $437,100 |
| 2023 | $3,847 | $420,000 | $0 | $420,000 |
| 2022 | $3,781 | $348,800 | $0 | $348,800 |
| 2021 | $3,747 | $321,600 | $0 | $321,600 |
| 2020 | $3,721 | $307,500 | $0 | $307,500 |
| 2019 | $3,513 | $294,000 | $0 | $294,000 |
| 2018 | $3,760 | $309,700 | $0 | $309,700 |
| 2017 | $3,838 | $314,300 | $0 | $314,300 |
| 2016 | $3,931 | $323,300 | $0 | $323,300 |
| 2015 | $4,254 | $345,000 | $0 | $345,000 |
Source: Public Records
Map
Nearby Homes
- 15 Wexford Ct Unit 32
- 30 Clifden Ct Unit 2
- 54 Dunmore Ct
- 1 Pinecroft Dr
- 0 East St
- 137 Housatonic St
- 2 Saint Andrews Ct
- 4 Morgan Manor Unit 4
- 46 Housatonic St Unit 2B
- 220 Kemble St
- 31 Saint Ann's Ave
- 15 Hubbard St
- 500 Walker St
- 524 Walker St
- 528 Walker St
- 615 Laurel St
- 130 E Dugway Rd
- 770 Summer St Unit 5D
- 184 Washington Mountain Rd
- 140 Theresa Terrace
- 85 Clifden Ct Unit 43
- 85 Clifden Ct Unit 41
- 85 Clifden Ct Unit 46
- 85 Clifden Ct Unit 45
- 85 Clifden Ct Unit 44
- 85 Clifden Ct Unit 24
- 85 Clifden Ct Unit 21
- 85 Clifden Ct Unit 23
- 85 Clifden Ct Unit 20
- 85 Clifden Ct
- 15 Wexford Ct
- 15 Wexford Ct Unit 33
- 15 Wexford Ct Unit 36
- 15 Wexford Ct Unit 31
- 50 Clifden Ct Unit 33
- 50 Clifden Ct Unit 36
- 50 Clifden Ct Unit 35
- 50 Clifden Ct Unit 34
- 50 Clifden Ct Unit 32
- 50 Clifden Ct Unit 31
Your Personal Tour Guide
Ask me questions while you tour the home.