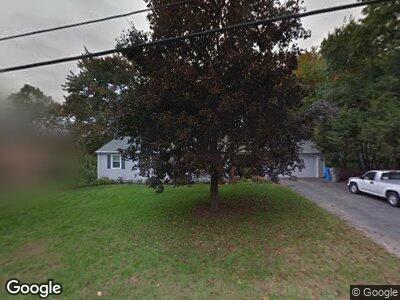
85 Delmar Dr Bristol, CT 06010
North Bristol NeighborhoodEstimated Value: $318,877 - $345,000
3
Beds
1
Bath
1,284
Sq Ft
$259/Sq Ft
Est. Value
About This Home
This home is located at 85 Delmar Dr, Bristol, CT 06010 and is currently estimated at $332,969, approximately $259 per square foot. 85 Delmar Dr is a home located in Hartford County with nearby schools including Ivy Drive School, Northeast Middle School, and Bristol Eastern High School.
Ownership History
Date
Name
Owned For
Owner Type
Purchase Details
Closed on
Feb 28, 2014
Sold by
Cote Yvette M
Bought by
Cote Michael J
Current Estimated Value
Home Financials for this Owner
Home Financials are based on the most recent Mortgage that was taken out on this home.
Original Mortgage
$148,000
Outstanding Balance
$50,983
Interest Rate
4.27%
Estimated Equity
$282,034
Purchase Details
Closed on
Jun 19, 2008
Sold by
Forster Daniel S and Forster Tina M
Bought by
Cote Michael J and Cote Yvette M
Home Financials for this Owner
Home Financials are based on the most recent Mortgage that was taken out on this home.
Original Mortgage
$174,400
Interest Rate
6%
Purchase Details
Closed on
Sep 19, 2002
Sold by
Conklin Evelyn S
Bought by
Forster Daniel S
Purchase Details
Closed on
Jan 11, 1995
Sold by
Fhlmc
Bought by
Rounseville Wendy Lee
Create a Home Valuation Report for This Property
The Home Valuation Report is an in-depth analysis detailing your home's value as well as a comparison with similar homes in the area
Home Values in the Area
Average Home Value in this Area
Purchase History
| Date | Buyer | Sale Price | Title Company |
|---|---|---|---|
| Cote Michael J | -- | -- | |
| Cote Michael J | $218,000 | -- | |
| Forster Daniel S | $211,750 | -- | |
| Rounseville Wendy Lee | $190,000 | -- |
Source: Public Records
Mortgage History
| Date | Status | Borrower | Loan Amount |
|---|---|---|---|
| Open | Rounseville Wendy Lee | $148,000 | |
| Closed | Rounseville Wendy Lee | $27,700 | |
| Previous Owner | Rounseville Wendy Lee | $174,400 |
Source: Public Records
Tax History Compared to Growth
Tax History
| Year | Tax Paid | Tax Assessment Tax Assessment Total Assessment is a certain percentage of the fair market value that is determined by local assessors to be the total taxable value of land and additions on the property. | Land | Improvement |
|---|---|---|---|---|
| 2024 | $5,587 | $175,420 | $54,390 | $121,030 |
| 2023 | $5,324 | $175,420 | $54,390 | $121,030 |
| 2022 | $4,558 | $118,860 | $37,800 | $81,060 |
| 2021 | $4,558 | $118,860 | $37,800 | $81,060 |
| 2020 | $4,558 | $118,860 | $37,800 | $81,060 |
| 2019 | $4,523 | $118,860 | $37,800 | $81,060 |
| 2018 | $4,384 | $118,860 | $37,800 | $81,060 |
| 2017 | $4,668 | $129,570 | $53,970 | $75,600 |
| 2016 | $4,668 | $129,570 | $53,970 | $75,600 |
| 2015 | $4,484 | $129,570 | $53,970 | $75,600 |
| 2014 | $4,484 | $129,570 | $53,970 | $75,600 |
Source: Public Records
Map
Nearby Homes