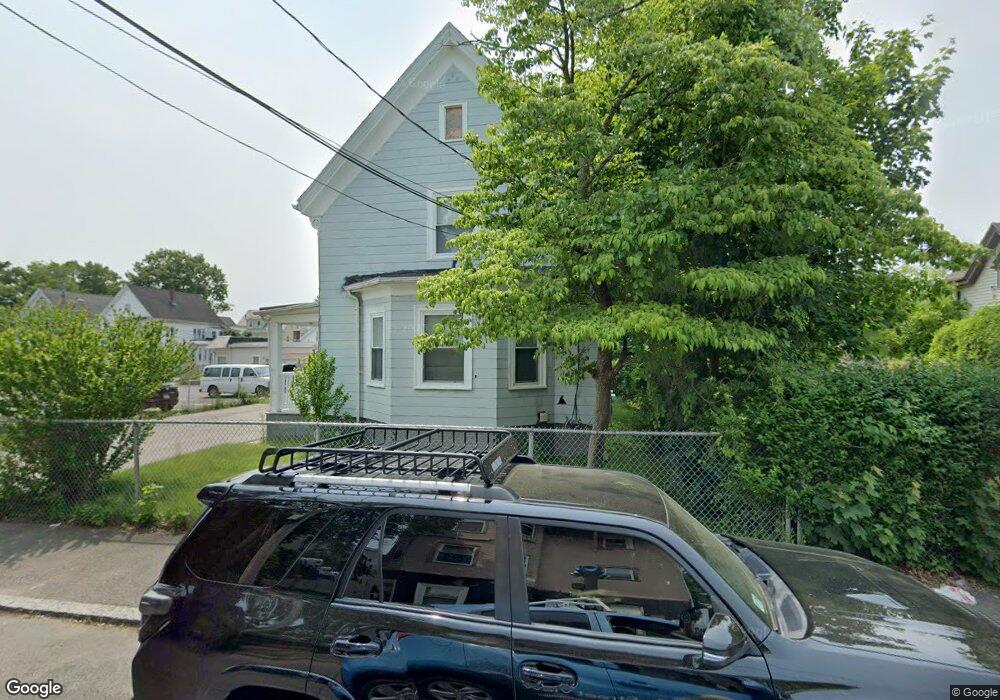
85 Denton St Unit 1 Brockton, MA 02301
Clifton Heights NeighborhoodEstimated Value: $354,000 - $696,000
2
Beds
2
Baths
1,055
Sq Ft
$526/Sq Ft
Est. Value
About This Home
This home is located at 85 Denton St Unit 1, Brockton, MA 02301 and is currently estimated at $554,417, approximately $525 per square foot. 85 Denton St Unit 1 is a home located in Plymouth County with nearby schools including John F. Kennedy Elementary School, Davis K-8 School, and South Middle School.
Ownership History
Date
Name
Owned For
Owner Type
Purchase Details
Closed on
Nov 5, 2021
Sold by
Horta Feliciano C and Horta Maria M
Bought by
Semedo Maria E and Semedo-Miranda Emanuel
Current Estimated Value
Home Financials for this Owner
Home Financials are based on the most recent Mortgage that was taken out on this home.
Original Mortgage
$589,132
Outstanding Balance
$539,008
Interest Rate
2.88%
Mortgage Type
FHA
Estimated Equity
$15,409
Purchase Details
Closed on
May 29, 2015
Sold by
Barros Alberto M and Barros Marta A
Bought by
Horta Feliciano C and Horta Maria M
Home Financials for this Owner
Home Financials are based on the most recent Mortgage that was taken out on this home.
Original Mortgage
$274,928
Interest Rate
3.87%
Mortgage Type
FHA
Create a Home Valuation Report for This Property
The Home Valuation Report is an in-depth analysis detailing your home's value as well as a comparison with similar homes in the area
Home Values in the Area
Average Home Value in this Area
Purchase History
| Date | Buyer | Sale Price | Title Company |
|---|---|---|---|
| Semedo Maria E | $600,000 | None Available | |
| Horta Feliciano C | $280,000 | -- |
Source: Public Records
Mortgage History
| Date | Status | Borrower | Loan Amount |
|---|---|---|---|
| Open | Semedo Maria E | $589,132 | |
| Previous Owner | Horta Feliciano C | $274,928 |
Source: Public Records
Tax History Compared to Growth
Tax History
| Year | Tax Paid | Tax Assessment Tax Assessment Total Assessment is a certain percentage of the fair market value that is determined by local assessors to be the total taxable value of land and additions on the property. | Land | Improvement |
|---|---|---|---|---|
| 2025 | $7,767 | $641,400 | $140,400 | $501,000 |
| 2024 | $7,104 | $591,000 | $140,400 | $450,600 |
| 2023 | $7,314 | $563,500 | $106,000 | $457,500 |
| 2022 | $6,517 | $466,500 | $96,400 | $370,100 |
| 2021 | $5,815 | $401,000 | $80,400 | $320,600 |
| 2020 | $5,243 | $346,100 | $75,000 | $271,100 |
| 2019 | $5,318 | $342,200 | $73,000 | $269,200 |
| 2018 | $5,247 | $296,600 | $73,000 | $223,600 |
| 2017 | $4,440 | $275,800 | $73,000 | $202,800 |
| 2016 | $4,573 | $263,400 | $70,900 | $192,500 |
| 2015 | -- | $195,700 | $70,900 | $124,800 |
| 2014 | $3,606 | $198,900 | $70,900 | $128,000 |
Source: Public Records
Map
Nearby Homes