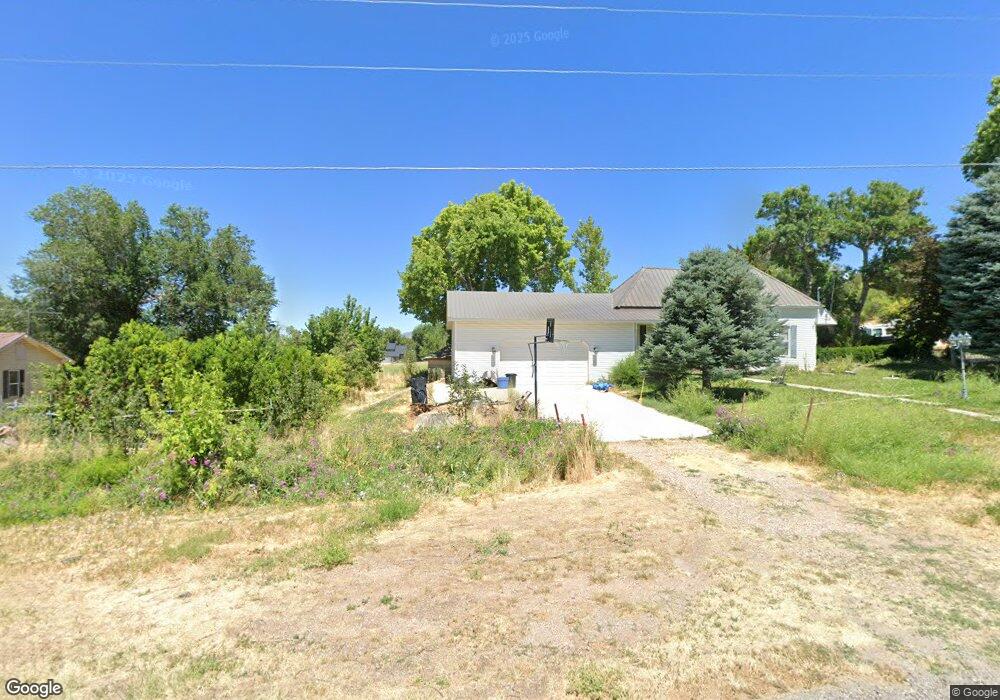
85 E 200 S Fillmore, UT 84631
Estimated Value: $326,406 - $445,000
2
Beds
1
Bath
1,396
Sq Ft
$264/Sq Ft
Est. Value
About This Home
This home is located at 85 E 200 S, Fillmore, UT 84631 and is currently estimated at $368,102, approximately $263 per square foot. 85 E 200 S is a home located in Millard County.
Ownership History
Date
Name
Owned For
Owner Type
Purchase Details
Closed on
Mar 12, 2024
Sold by
Neely Larry and Neely Carrie
Bought by
Larry And Carrie Neely Living Trust and Neely
Current Estimated Value
Purchase Details
Closed on
Sep 1, 2009
Sold by
Gates Barbara
Bought by
Gates Barbara and Gates Sarah Ann
Purchase Details
Closed on
Mar 25, 2009
Sold by
Utah Acquisition Company Llc
Bought by
Gates Barbara
Home Financials for this Owner
Home Financials are based on the most recent Mortgage that was taken out on this home.
Original Mortgage
$110,000
Interest Rate
5.06%
Purchase Details
Closed on
Dec 15, 2008
Sold by
Idaho Falls Acquisition Company Llc
Bought by
Utah Acquisition Company Llc
Purchase Details
Closed on
Jan 24, 2008
Sold by
Jackson Merlin Lee and Jackson Julie B
Bought by
Idaho Falls Acquisition Company Llc
Purchase Details
Closed on
Jan 17, 2007
Sold by
Callahan Robert
Bought by
Ga Roper Investments Ltd
Create a Home Valuation Report for This Property
The Home Valuation Report is an in-depth analysis detailing your home's value as well as a comparison with similar homes in the area
Home Values in the Area
Average Home Value in this Area
Purchase History
| Date | Buyer | Sale Price | Title Company |
|---|---|---|---|
| Larry And Carrie Neely Living Trust | -- | None Listed On Document | |
| Gates Barbara | -- | -- | |
| Gates Barbara | -- | -- | |
| Utah Acquisition Company Llc | -- | -- | |
| Idaho Falls Acquisition Company Llc | -- | -- | |
| Ga Roper Investments Ltd | -- | -- |
Source: Public Records
Mortgage History
| Date | Status | Borrower | Loan Amount |
|---|---|---|---|
| Previous Owner | Gates Barbara | $110,000 |
Source: Public Records
Tax History
| Year | Tax Paid | Tax Assessment Tax Assessment Total Assessment is a certain percentage of the fair market value that is determined by local assessors to be the total taxable value of land and additions on the property. | Land | Improvement |
|---|---|---|---|---|
| 2025 | $914 | $166,904 | $21,072 | $145,832 |
| 2024 | $914 | $128,661 | $20,292 | $108,369 |
| 2023 | $1,401 | $128,661 | $20,292 | $108,369 |
| 2022 | $836 | $103,487 | $18,448 | $85,039 |
| 2021 | $688 | $86,895 | $11,979 | $74,916 |
| 2020 | $126 | $80,946 | $10,890 | $70,056 |
| 2019 | $0 | $69,228 | $10,890 | $58,338 |
| 2018 | $0 | $67,583 | $10,890 | $56,693 |
| 2017 | $0 | $58,781 | $10,890 | $47,891 |
| 2016 | $664 | $58,781 | $10,890 | $47,891 |
| 2015 | $594 | $52,572 | $10,890 | $41,682 |
| 2014 | -- | $52,572 | $10,890 | $41,682 |
| 2013 | -- | $52,572 | $10,890 | $41,682 |
Source: Public Records
Map
Nearby Homes
- 220 S 200 E
- 40 S 100 Rd E
- 235 S 200 St E
- 155 W Center St
- 155 E 500 St S
- 157 E 500 South St
- 465 S 100 W
- 75 N 100 West St
- 260 W 200 S
- 405 E 500 St S
- 351 W 100 South St
- 225 W 200 St N
- 245 W 300 N
- 310 S 500 West Rd
- 390 N 100 W
- 760 E 700 St S
- 690 E 500 S
- 335 W 400 North St
- 750 800 South Fillmore
- 825 800 South Fillmore
Your Personal Tour Guide
Ask me questions while you tour the home.