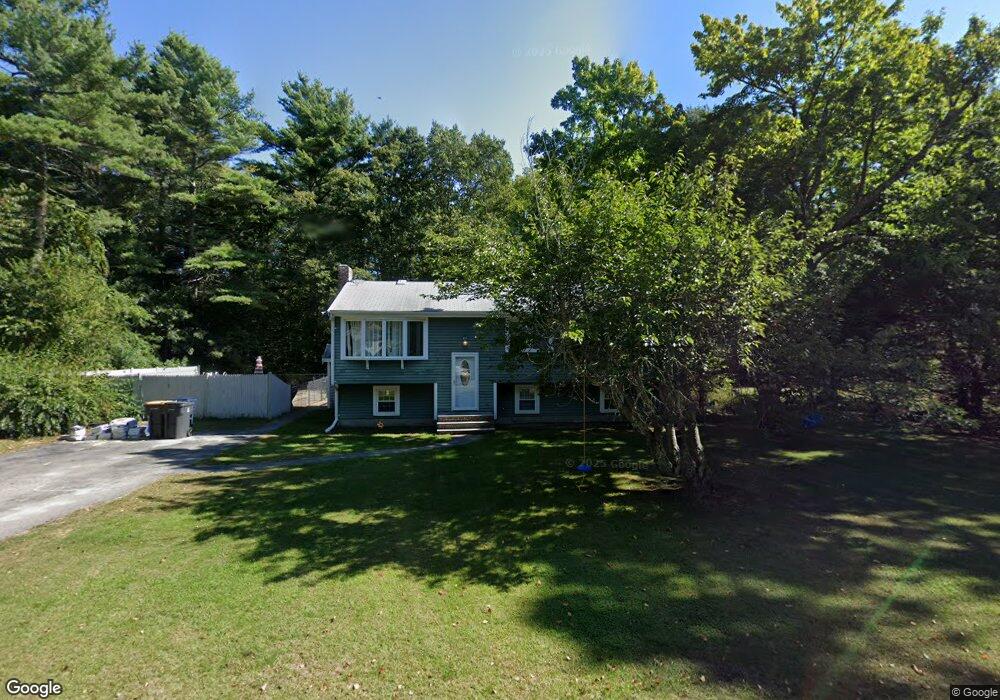
85 Fosdick Rd Carver, MA 02330
Estimated Value: $476,000 - $515,598
3
Beds
1
Bath
1,008
Sq Ft
$494/Sq Ft
Est. Value
About This Home
This home is located at 85 Fosdick Rd, Carver, MA 02330 and is currently estimated at $497,900, approximately $493 per square foot. 85 Fosdick Rd is a home located in Plymouth County with nearby schools including Carver Elementary School and Samuel Fuller School.
Ownership History
Date
Name
Owned For
Owner Type
Purchase Details
Closed on
Oct 6, 2019
Sold by
Hallett James H and Hallet Sandra
Bought by
Hallett Sandra
Current Estimated Value
Purchase Details
Closed on
Jul 7, 1999
Sold by
Moors Merton J and Moors Janet L
Bought by
Hallett James H and Hallett Sandra
Create a Home Valuation Report for This Property
The Home Valuation Report is an in-depth analysis detailing your home's value as well as a comparison with similar homes in the area
Home Values in the Area
Average Home Value in this Area
Purchase History
| Date | Buyer | Sale Price | Title Company |
|---|---|---|---|
| Hallett Sandra | -- | -- | |
| Hallett James H | $120,200 | -- |
Source: Public Records
Mortgage History
| Date | Status | Borrower | Loan Amount |
|---|---|---|---|
| Previous Owner | Hallett James H | $251,000 | |
| Previous Owner | Hallett James H | $246,000 | |
| Previous Owner | Hallett James H | $35,000 |
Source: Public Records
Tax History Compared to Growth
Tax History
| Year | Tax Paid | Tax Assessment Tax Assessment Total Assessment is a certain percentage of the fair market value that is determined by local assessors to be the total taxable value of land and additions on the property. | Land | Improvement |
|---|---|---|---|---|
| 2025 | $6,015 | $433,700 | $130,800 | $302,900 |
| 2024 | $5,944 | $419,500 | $128,300 | $291,200 |
| 2023 | $5,725 | $392,400 | $128,300 | $264,100 |
| 2022 | $5,396 | $337,700 | $109,700 | $228,000 |
| 2021 | $5,192 | $306,500 | $97,900 | $208,600 |
| 2020 | $4,944 | $287,600 | $91,500 | $196,100 |
| 2019 | $4,769 | $279,700 | $88,800 | $190,900 |
| 2018 | $4,697 | $260,500 | $88,800 | $171,700 |
| 2017 | $4,396 | $248,500 | $85,500 | $163,000 |
| 2016 | $3,973 | $233,300 | $81,400 | $151,900 |
| 2015 | $3,897 | $229,100 | $81,400 | $147,700 |
| 2014 | $3,854 | $226,600 | $102,900 | $123,700 |
Source: Public Records
Map
Nearby Homes
- 23 Shaw St
- 35 Silva St
- 269 Purchase St
- 235 Main St
- 7 Green St
- 5 Carver Square Blvd Unit 5
- 5 Carver Square Blvd
- 81 Center St
- 26 Santana Way Unit 26
- 11 Brockton Ave
- 141 Rocky Meadow St
- Lot1 Elk Run Dr
- 135 Plymouth St
- 64 Wenham Rd
- 4 Bella Path
- 6 Susan Cir
- 9 Terrace Way
- 236 Thomas St
- 48 S Meadow Village
- 22 S Meadow Village