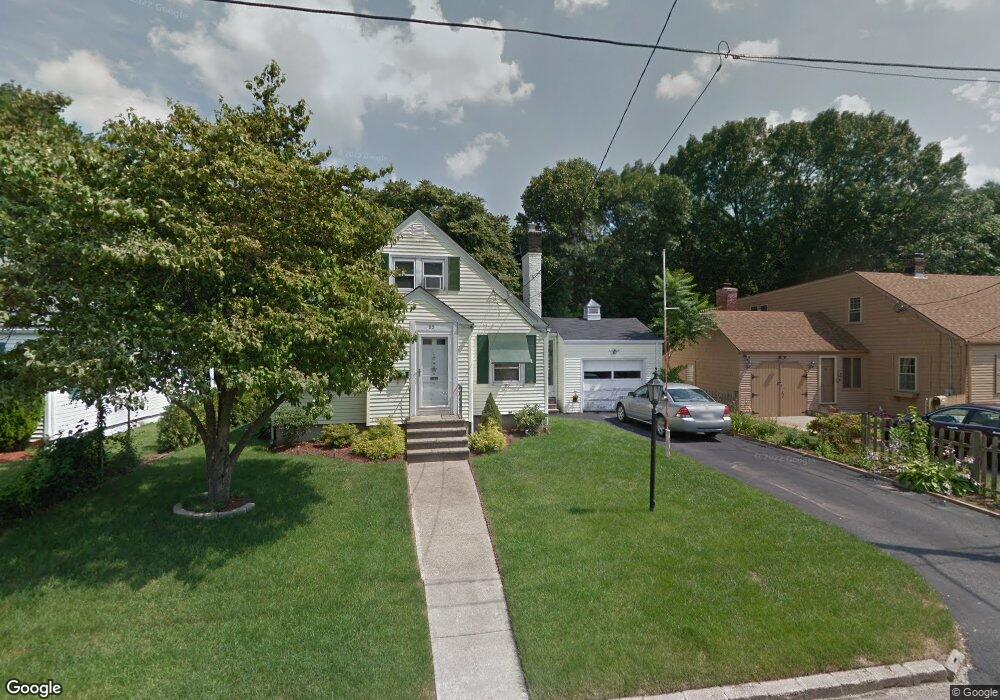
85 Howland Rd Cranston, RI 02910
Eden Park NeighborhoodEstimated Value: $392,448 - $447,000
3
Beds
2
Baths
2,760
Sq Ft
$149/Sq Ft
Est. Value
About This Home
This home is located at 85 Howland Rd, Cranston, RI 02910 and is currently estimated at $411,362, approximately $149 per square foot. 85 Howland Rd is a home located in Providence County with nearby schools including Park View Middle School, Cranston High School East, and Nel/Cps Construction Career.
Ownership History
Date
Name
Owned For
Owner Type
Purchase Details
Closed on
Sep 8, 2008
Sold by
Downey S & L Assoc
Bought by
Conneally Dawn and Conneally John
Current Estimated Value
Home Financials for this Owner
Home Financials are based on the most recent Mortgage that was taken out on this home.
Original Mortgage
$173,342
Interest Rate
6.69%
Mortgage Type
Purchase Money Mortgage
Purchase Details
Closed on
Jul 15, 2005
Sold by
Verheijen Jeroen C and Verheijen Laura
Bought by
Golden David
Home Financials for this Owner
Home Financials are based on the most recent Mortgage that was taken out on this home.
Original Mortgage
$246,050
Interest Rate
5.67%
Mortgage Type
Purchase Money Mortgage
Purchase Details
Closed on
Apr 30, 2002
Sold by
Mclellan John H
Bought by
Verheijen Jeroen C and Verheijen Laura
Create a Home Valuation Report for This Property
The Home Valuation Report is an in-depth analysis detailing your home's value as well as a comparison with similar homes in the area
Home Values in the Area
Average Home Value in this Area
Purchase History
| Date | Buyer | Sale Price | Title Company |
|---|---|---|---|
| Conneally Dawn | $175,500 | -- | |
| Golden David | $259,000 | -- | |
| Verheijen Jeroen C | $155,000 | -- |
Source: Public Records
Mortgage History
| Date | Status | Borrower | Loan Amount |
|---|---|---|---|
| Open | Verheijen Jeroen C | $175,595 | |
| Closed | Verheijen Jeroen C | $173,342 | |
| Previous Owner | Verheijen Jeroen C | $246,050 |
Source: Public Records
Tax History
| Year | Tax Paid | Tax Assessment Tax Assessment Total Assessment is a certain percentage of the fair market value that is determined by local assessors to be the total taxable value of land and additions on the property. | Land | Improvement |
|---|---|---|---|---|
| 2025 | $4,453 | $320,800 | $108,600 | $212,200 |
| 2024 | $4,294 | $315,500 | $108,600 | $206,900 |
| 2023 | $4,205 | $222,500 | $71,500 | $151,000 |
| 2022 | $4,118 | $222,500 | $71,500 | $151,000 |
| 2021 | $4,005 | $222,500 | $71,500 | $151,000 |
| 2020 | $3,813 | $183,600 | $68,100 | $115,500 |
| 2019 | $3,813 | $183,600 | $68,100 | $115,500 |
| 2018 | $3,725 | $183,600 | $68,100 | $115,500 |
| 2017 | $3,629 | $158,200 | $61,300 | $96,900 |
| 2016 | $3,552 | $158,200 | $61,300 | $96,900 |
| 2015 | $3,552 | $158,200 | $61,300 | $96,900 |
| 2014 | $3,638 | $159,300 | $61,300 | $98,000 |
Source: Public Records
Map
Nearby Homes
Your Personal Tour Guide
Ask me questions while you tour the home.