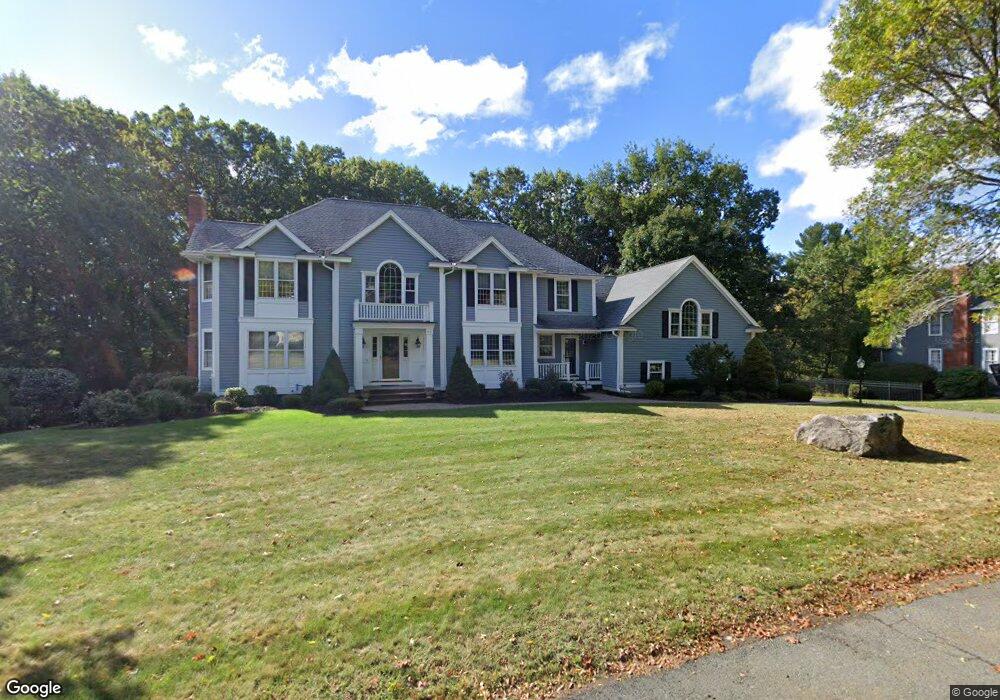
85 Lancaster Rd North Andover, MA 01845
Estimated Value: $1,602,254 - $1,824,000
4
Beds
4
Baths
5,991
Sq Ft
$288/Sq Ft
Est. Value
About This Home
This home is located at 85 Lancaster Rd, North Andover, MA 01845 and is currently estimated at $1,723,314, approximately $287 per square foot. 85 Lancaster Rd is a home located in Essex County with nearby schools including Franklin Elementary School, North Andover Middle School, and North Andover High School.
Ownership History
Date
Name
Owned For
Owner Type
Purchase Details
Closed on
May 7, 2018
Sold by
Murphy Brian P and Murphy Nancy T
Bought by
Collar Matthew M and Collar Lea M
Current Estimated Value
Home Financials for this Owner
Home Financials are based on the most recent Mortgage that was taken out on this home.
Original Mortgage
$682,500
Outstanding Balance
$588,331
Interest Rate
4.45%
Mortgage Type
Unknown
Estimated Equity
$1,134,983
Purchase Details
Closed on
Apr 20, 1994
Sold by
A J Maillet Constr
Bought by
Murphy Brian P
Home Financials for this Owner
Home Financials are based on the most recent Mortgage that was taken out on this home.
Original Mortgage
$433,900
Interest Rate
7.6%
Mortgage Type
Purchase Money Mortgage
Create a Home Valuation Report for This Property
The Home Valuation Report is an in-depth analysis detailing your home's value as well as a comparison with similar homes in the area
Home Values in the Area
Average Home Value in this Area
Purchase History
| Date | Buyer | Sale Price | Title Company |
|---|---|---|---|
| Collar Matthew M | $975,000 | -- | |
| Murphy Brian P | $510,500 | -- |
Source: Public Records
Mortgage History
| Date | Status | Borrower | Loan Amount |
|---|---|---|---|
| Open | Collar Matthew M | $682,500 | |
| Previous Owner | Murphy Brian P | $433,900 |
Source: Public Records
Tax History
| Year | Tax Paid | Tax Assessment Tax Assessment Total Assessment is a certain percentage of the fair market value that is determined by local assessors to be the total taxable value of land and additions on the property. | Land | Improvement |
|---|---|---|---|---|
| 2025 | $16,597 | $1,474,000 | $446,400 | $1,027,600 |
| 2024 | $15,821 | $1,426,600 | $424,600 | $1,002,000 |
| 2023 | $14,901 | $1,217,400 | $340,100 | $877,300 |
| 2022 | $14,155 | $1,046,200 | $296,500 | $749,700 |
| 2021 | $13,342 | $941,600 | $270,400 | $671,200 |
| 2020 | $12,847 | $935,000 | $263,800 | $671,200 |
| 2019 | $12,538 | $935,000 | $263,800 | $671,200 |
| 2018 | $13,586 | $935,000 | $263,800 | $671,200 |
| 2017 | $13,212 | $925,200 | $237,700 | $687,500 |
| 2016 | $12,432 | $871,200 | $242,100 | $629,100 |
| 2015 | $12,469 | $866,500 | $226,600 | $639,900 |
Source: Public Records
Map
Nearby Homes
- 71 Regency Place
- 61 Abbott St
- 122 Forest St
- 45 Thistle Rd
- Lot 10 Stonecleave Rd
- 141 Cortland Dr Unit 141
- 141 Cortland Dr
- 590 Foster St
- 224 Raleigh Tavern Ln
- 991 Johnson St
- 10 Bridle Path
- 88 Johnson St
- 65 Saile Way
- 447 Stevens St
- 94 Lawrence Rd
- 3 Great Pond Rd
- 124 Quail Run Rd
- 136 Quail Run Rd
- 37 Sullivan St
- 42 Hewitt Ave
- 73 Lancaster Rd
- 91 Lancaster Rd
- 90 Lancaster Rd
- 61 Lancaster Rd
- 54 Lancaster Rd
- 103 Lancaster Rd
- 110 Lancaster Rd
- 115 Lancaster Rd
- 32 Salem St Unit Lot 32
- 32 Salem St Unit Model G
- 36 Lancaster Rd
- 122 Lancaster Rd
- 53 Lancaster Rd
- 41 Hidden Ct
- 41 Hidden Ct Unit a
- 136 Lancaster Rd
- 24 Lancaster Rd
- LOT 18 Lancaster Rd
- 25 Hidden Ct
- 31 Lancaster Rd
Your Personal Tour Guide
Ask me questions while you tour the home.