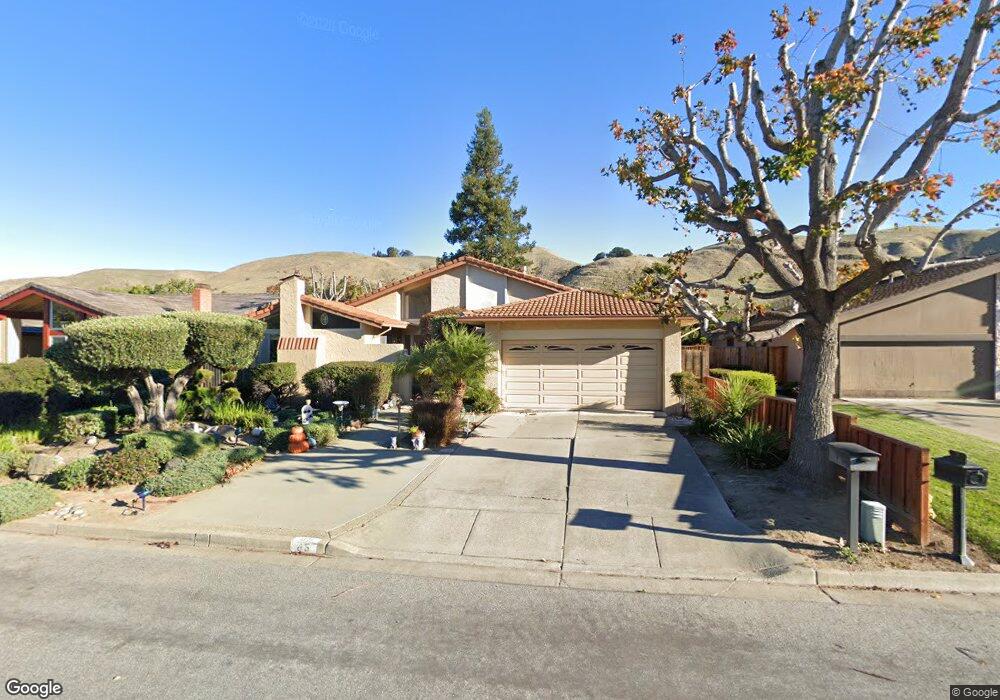
85 Madrid Place Fremont, CA 94539
Kimber-Gomes NeighborhoodEstimated Value: $2,187,870 - $2,734,000
3
Beds
2
Baths
1,880
Sq Ft
$1,335/Sq Ft
Est. Value
About This Home
This home is located at 85 Madrid Place, Fremont, CA 94539 and is currently estimated at $2,510,718, approximately $1,335 per square foot. 85 Madrid Place is a home located in Alameda County with nearby schools including John Gomes Elementary School, William Hopkins Junior High School, and Mission San Jose High School.
Ownership History
Date
Name
Owned For
Owner Type
Purchase Details
Closed on
Feb 26, 2013
Sold by
Vargas James E and Vargas Victoria S
Bought by
Vargas James E and Vargas Victoria S
Current Estimated Value
Home Financials for this Owner
Home Financials are based on the most recent Mortgage that was taken out on this home.
Original Mortgage
$287,000
Outstanding Balance
$202,069
Interest Rate
3.49%
Mortgage Type
New Conventional
Estimated Equity
$2,308,649
Purchase Details
Closed on
May 28, 2009
Sold by
Vargas James E and Vargas Victoria S
Bought by
Vargas James E and Vargas Victoria S
Purchase Details
Closed on
Jun 25, 2001
Sold by
Foster Bernadine Zoe A and Foster Robert A
Bought by
Vargas James E and Vargas Victoria S
Home Financials for this Owner
Home Financials are based on the most recent Mortgage that was taken out on this home.
Original Mortgage
$350,000
Interest Rate
6.87%
Purchase Details
Closed on
May 10, 1995
Sold by
Foster Robert A and Foster Bernadine Zoe
Bought by
Foster Robert A and Foster Bernadine Zoe
Create a Home Valuation Report for This Property
The Home Valuation Report is an in-depth analysis detailing your home's value as well as a comparison with similar homes in the area
Home Values in the Area
Average Home Value in this Area
Purchase History
| Date | Buyer | Sale Price | Title Company |
|---|---|---|---|
| Vargas James E | -- | Lsi | |
| Vargas James E | -- | Lsi | |
| Vargas James E | -- | None Available | |
| Vargas James E | $710,000 | Fidelity National Title Co | |
| Foster Robert A | -- | -- |
Source: Public Records
Mortgage History
| Date | Status | Borrower | Loan Amount |
|---|---|---|---|
| Open | Vargas James E | $287,000 | |
| Closed | Vargas James E | $350,000 |
Source: Public Records
Tax History Compared to Growth
Tax History
| Year | Tax Paid | Tax Assessment Tax Assessment Total Assessment is a certain percentage of the fair market value that is determined by local assessors to be the total taxable value of land and additions on the property. | Land | Improvement |
|---|---|---|---|---|
| 2025 | $12,322 | $1,041,811 | $314,643 | $734,168 |
| 2024 | $12,322 | $1,021,250 | $308,475 | $719,775 |
| 2023 | $11,995 | $1,008,093 | $302,428 | $705,665 |
| 2022 | $11,846 | $981,326 | $296,498 | $691,828 |
| 2021 | $11,551 | $961,950 | $290,685 | $678,265 |
| 2020 | $11,608 | $959,017 | $287,705 | $671,312 |
| 2019 | $11,473 | $940,217 | $282,065 | $658,152 |
| 2018 | $11,248 | $921,785 | $276,535 | $645,250 |
| 2017 | $10,964 | $903,715 | $271,114 | $632,601 |
| 2016 | $10,780 | $886,001 | $265,800 | $620,201 |
| 2015 | $10,660 | $872,695 | $261,808 | $610,887 |
| 2014 | $10,478 | $855,606 | $256,682 | $598,924 |
Source: Public Records
Map
Nearby Homes
- 40613 Encanto Way
- 294 Rosado Rd
- 40107 Catalina Place
- 40743 Rainwater Ct Unit 80
- 39478 Zacate Ave
- 41246 Mission Blvd
- 41252 Mission Blvd
- 1123 Farragut Dr
- 1962 Briscoe Terrace
- 39331 Marbella Terraza
- 0 Morrison Canyon Rd
- 41082 Joyce Ave
- 41043 Joyce Ave
- 39285 Marbella Terraza Unit 9P
- 1224 Bedford St
- 41519 Apricot Ln
- 1910 Barrymore Common Unit C
- 1960 Barrymore Common Unit K
- 39199 Guardino Dr Unit 179
- 39199 Guardino Dr Unit 371
- 87 Madrid Place
- 83 Madrid Place
- 40391 Dolerita Ave
- 40385 Dolerita Ave
- 40427 Dolerita Ave
- 91 Madrid Place
- 81 Madrid Place
- 82 Madrid Place
- 84 Madrid Place
- 40453 Dolerita Ave
- 80 Madrid Place
- 79 Madrid Place
- 86 Madrid Place
- 76 Madrid Place
- 78 Madrid Place
- 40491 Dolerita Ave
- 88 Madrid Place
- 40426 Dolerita Ave
- 40297 Dolerita Ave
- 40452 Dolerita Ave