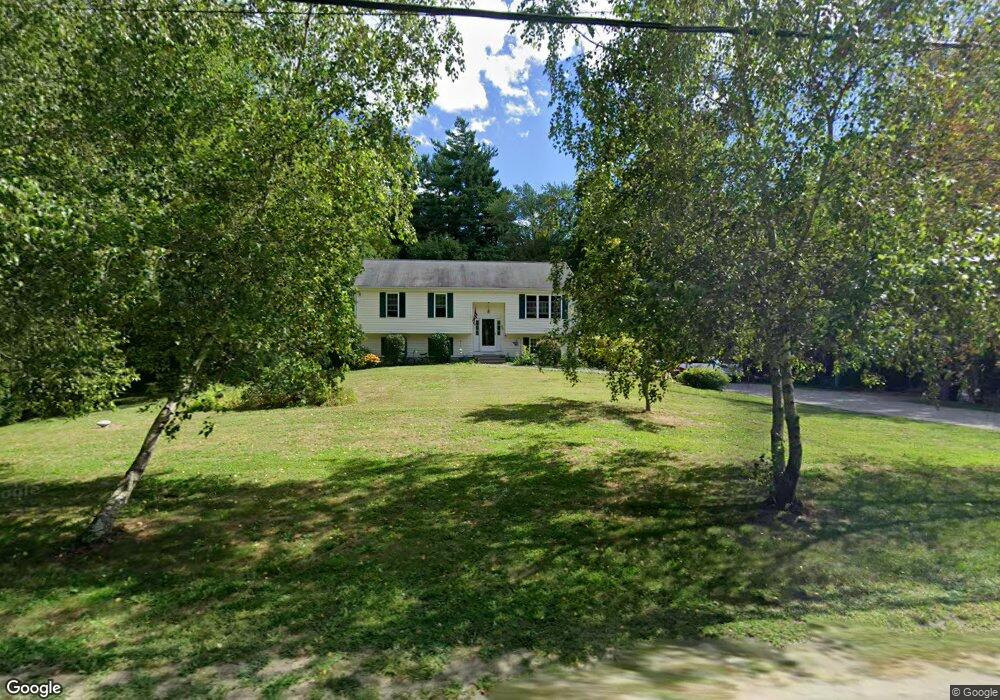
85 Myricks St Berkley, MA 02779
Estimated Value: $546,527 - $606,000
3
Beds
1
Bath
1,144
Sq Ft
$505/Sq Ft
Est. Value
About This Home
This home is located at 85 Myricks St, Berkley, MA 02779 and is currently estimated at $578,132, approximately $505 per square foot. 85 Myricks St is a home located in Bristol County with nearby schools including Berkley Community School.
Ownership History
Date
Name
Owned For
Owner Type
Purchase Details
Closed on
Dec 6, 2019
Sold by
Quinn Stephen J and Quinn Pamela J
Bought by
Quinn Lt
Current Estimated Value
Purchase Details
Closed on
Mar 23, 2010
Sold by
Quinn Stephen J and Quinn Pamela J
Bought by
Quinn Stephen J and Quinn Pamela J
Home Financials for this Owner
Home Financials are based on the most recent Mortgage that was taken out on this home.
Original Mortgage
$155,000
Interest Rate
5.17%
Purchase Details
Closed on
Apr 28, 2000
Sold by
Taylor Built Inc
Bought by
Quinn Stephen J and Allen Pamela
Home Financials for this Owner
Home Financials are based on the most recent Mortgage that was taken out on this home.
Original Mortgage
$142,400
Interest Rate
8.23%
Mortgage Type
Purchase Money Mortgage
Create a Home Valuation Report for This Property
The Home Valuation Report is an in-depth analysis detailing your home's value as well as a comparison with similar homes in the area
Home Values in the Area
Average Home Value in this Area
Purchase History
| Date | Buyer | Sale Price | Title Company |
|---|---|---|---|
| Quinn Lt | -- | None Available | |
| Quinn Stephen J | -- | -- | |
| Quinn Stephen J | $178,000 | -- |
Source: Public Records
Mortgage History
| Date | Status | Borrower | Loan Amount |
|---|---|---|---|
| Previous Owner | Quinn Stephen J | $155,000 | |
| Previous Owner | Quinn Stephen J | $142,500 | |
| Previous Owner | Quinn Stephen J | $142,400 |
Source: Public Records
Tax History Compared to Growth
Tax History
| Year | Tax Paid | Tax Assessment Tax Assessment Total Assessment is a certain percentage of the fair market value that is determined by local assessors to be the total taxable value of land and additions on the property. | Land | Improvement |
|---|---|---|---|---|
| 2025 | $59 | $493,700 | $158,900 | $334,800 |
| 2024 | $5,612 | $450,800 | $136,900 | $313,900 |
| 2023 | $5,293 | $400,400 | $136,900 | $263,500 |
| 2022 | $5,137 | $373,600 | $119,100 | $254,500 |
| 2021 | $5,011 | $350,900 | $113,400 | $237,500 |
| 2020 | $4,825 | $332,100 | $100,400 | $231,700 |
| 2019 | $4,670 | $319,000 | $100,400 | $218,600 |
| 2018 | $4,286 | $305,700 | $96,500 | $209,200 |
| 2017 | $4,197 | $293,500 | $108,100 | $185,400 |
| 2016 | $4,088 | $275,500 | $108,100 | $167,400 |
| 2015 | $3,867 | $278,000 | $108,100 | $169,900 |
| 2014 | $3,683 | $287,500 | $117,300 | $170,200 |
Source: Public Records
Map
Nearby Homes
- 52 Anthony St
- 11 Claire Terrace
- 14 Alberta Ln
- 1 Great Cedar Dr
- 7 Great Cedar Crossing
- 68 Metacomet Ave
- 59 Seymour St
- 0 Kingman St Unit 73419343
- 15 Leonard Ave
- 55 Hill St
- 3 Hidden Ridge Rd
- 70 Plain St E
- 0 Kingman St
- 95 Howland Rd
- 203 Bluejay Ln
- 48A + 50 Montgomery St
- 28 B Staples St Unit B
- Lot 2 Sherwood Ln
- Lot 1 Sherwood Ln
- 6 Weetamoe Dr