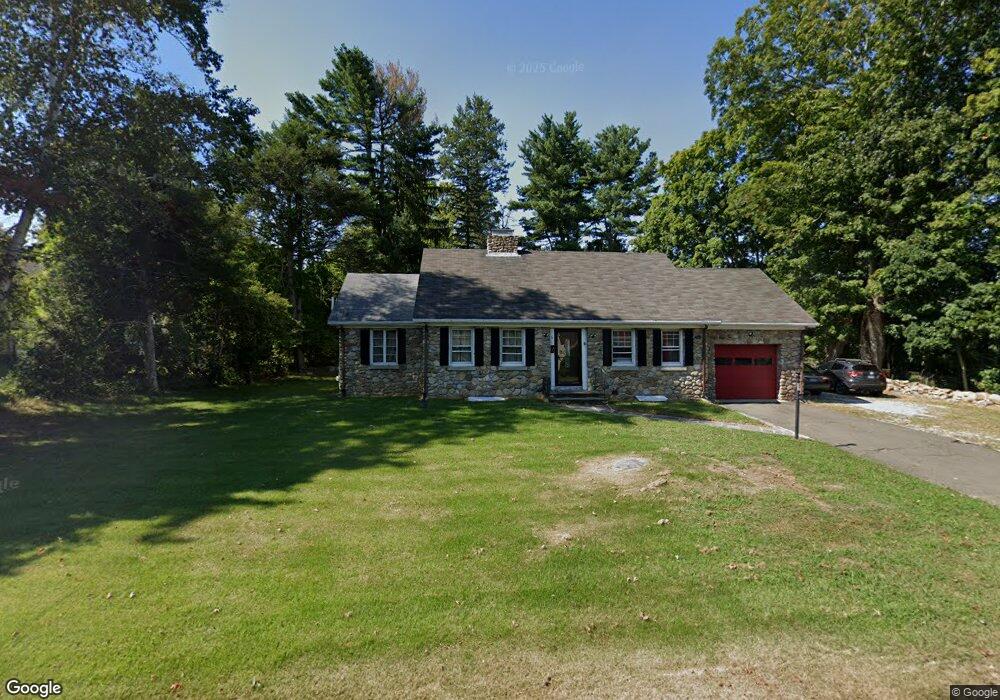
85 N High St Clinton, CT 06413
Estimated Value: $446,000 - $457,000
4
Beds
3
Baths
2,255
Sq Ft
$200/Sq Ft
Est. Value
About This Home
This home is located at 85 N High St, Clinton, CT 06413 and is currently estimated at $450,840, approximately $199 per square foot. 85 N High St is a home located in Middlesex County with nearby schools including Lewin G. Joel Jr. School, The Morgan School, and Our Lady of Mercy Preparatory Academy.
Ownership History
Date
Name
Owned For
Owner Type
Purchase Details
Closed on
Sep 24, 2012
Sold by
N High St Llc
Bought by
Bovich Steven P and Bovich Jodi W
Current Estimated Value
Home Financials for this Owner
Home Financials are based on the most recent Mortgage that was taken out on this home.
Original Mortgage
$182,000
Outstanding Balance
$126,055
Interest Rate
3.59%
Mortgage Type
New Conventional
Estimated Equity
$324,785
Purchase Details
Closed on
Jun 2, 2010
Sold by
Adams Helen
Bought by
North High Street Llc
Home Financials for this Owner
Home Financials are based on the most recent Mortgage that was taken out on this home.
Original Mortgage
$200,000
Interest Rate
5.12%
Create a Home Valuation Report for This Property
The Home Valuation Report is an in-depth analysis detailing your home's value as well as a comparison with similar homes in the area
Home Values in the Area
Average Home Value in this Area
Purchase History
| Date | Buyer | Sale Price | Title Company |
|---|---|---|---|
| Bovich Steven P | -- | -- | |
| Bovich Steven P | -- | -- | |
| North High Street Llc | $250,000 | -- | |
| North High Street Llc | $250,000 | -- |
Source: Public Records
Mortgage History
| Date | Status | Borrower | Loan Amount |
|---|---|---|---|
| Open | North High Street Llc | $182,000 | |
| Closed | North High Street Llc | $182,000 | |
| Previous Owner | North High Street Llc | $200,000 |
Source: Public Records
Tax History Compared to Growth
Tax History
| Year | Tax Paid | Tax Assessment Tax Assessment Total Assessment is a certain percentage of the fair market value that is determined by local assessors to be the total taxable value of land and additions on the property. | Land | Improvement |
|---|---|---|---|---|
| 2025 | $5,440 | $174,700 | $53,200 | $121,500 |
| 2024 | $5,286 | $174,700 | $53,200 | $121,500 |
| 2023 | $5,211 | $174,700 | $53,200 | $121,500 |
| 2022 | $5,211 | $174,700 | $53,200 | $121,500 |
| 2021 | $5,020 | $168,300 | $53,300 | $115,000 |
| 2020 | $5,259 | $168,300 | $53,300 | $115,000 |
| 2019 | $5,259 | $168,300 | $53,300 | $115,000 |
| 2018 | $5,140 | $168,300 | $53,300 | $115,000 |
| 2017 | $5,034 | $168,300 | $53,300 | $115,000 |
| 2016 | $4,568 | $168,300 | $53,300 | $115,000 |
| 2015 | $4,899 | $183,000 | $61,700 | $121,300 |
| 2014 | $4,807 | $183,000 | $61,700 | $121,300 |
Source: Public Records
Map
Nearby Homes
- 82 N High St
- 52 High St
- 64 W Main St
- 0 Cow Hill Rd
- 28 Maple Ave
- 133 W Main St Unit TRLR A9
- 133 W Main St Unit MV1
- 133 W Main St Unit TRLR C6
- 129 W Main St
- 0 Fairy Dell Rd
- 13 Waterside Ln
- 26 Cedar Island Ave
- 72 Long Hill Rd
- 27 Maplewood Dr
- 76 Fairy Dell Rd
- 153 E Main St Unit 6
- 153 E Main St Unit 5
- 153 E Main St Unit 8
- 153 E Main St Unit 31
- 153 E Main St Unit 13