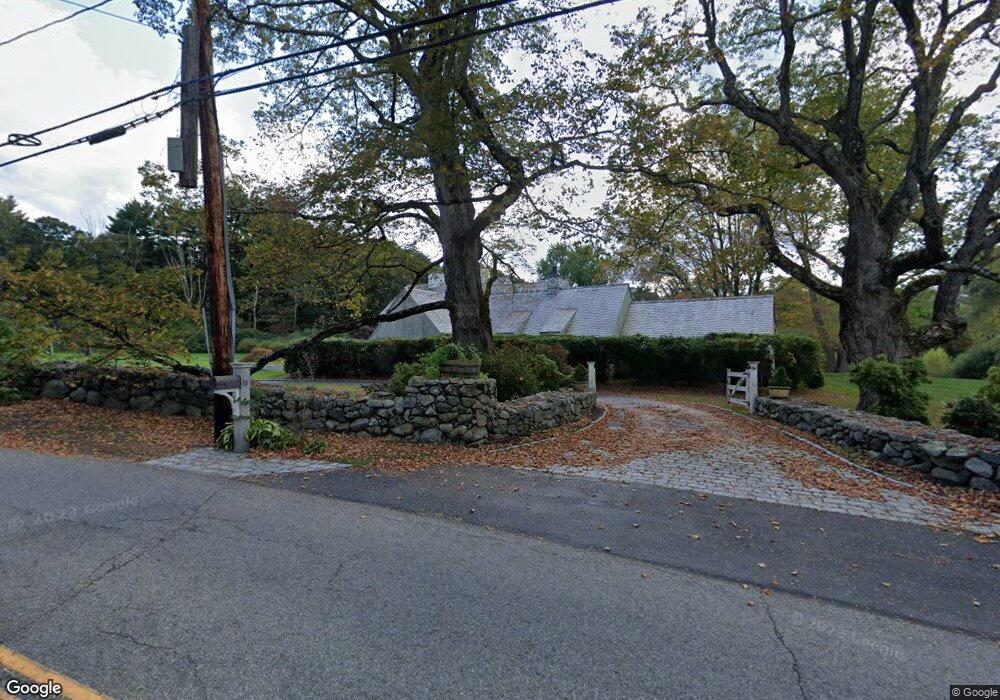
85 Oak St Unit 1 Weston, MA 02493
Estimated Value: $4,726,690 - $6,669,000
6
Beds
6
Baths
6,993
Sq Ft
$788/Sq Ft
Est. Value
About This Home
This home is located at 85 Oak St Unit 1, Weston, MA 02493 and is currently estimated at $5,510,923, approximately $788 per square foot. 85 Oak St Unit 1 is a home located in Middlesex County with nearby schools including Country Elementary School, Woodland Elementary School, and Weston Middle School.
Ownership History
Date
Name
Owned For
Owner Type
Purchase Details
Closed on
Aug 12, 2011
Sold by
Est Daly Lynn K and Daly Robert W
Bought by
85 Oak Street Rt and Theodorakos Vaios
Current Estimated Value
Home Financials for this Owner
Home Financials are based on the most recent Mortgage that was taken out on this home.
Original Mortgage
$2,000,000
Outstanding Balance
$1,380,896
Interest Rate
4.51%
Mortgage Type
Purchase Money Mortgage
Estimated Equity
$4,130,027
Purchase Details
Closed on
Jul 29, 1994
Sold by
Feist Howard N
Bought by
Daly Robert W and Daly Lynn K
Home Financials for this Owner
Home Financials are based on the most recent Mortgage that was taken out on this home.
Original Mortgage
$1,500,000
Interest Rate
8.25%
Mortgage Type
Purchase Money Mortgage
Create a Home Valuation Report for This Property
The Home Valuation Report is an in-depth analysis detailing your home's value as well as a comparison with similar homes in the area
Home Values in the Area
Average Home Value in this Area
Purchase History
| Date | Buyer | Sale Price | Title Company |
|---|---|---|---|
| 85 Oak Street Rt | $2,925,000 | -- | |
| Daly Robert W | $1,935,000 | -- |
Source: Public Records
Mortgage History
| Date | Status | Borrower | Loan Amount |
|---|---|---|---|
| Open | 85 Oak Street Rt | $2,000,000 | |
| Previous Owner | Daly Robert W | $1,500,000 |
Source: Public Records
Tax History Compared to Growth
Tax History
| Year | Tax Paid | Tax Assessment Tax Assessment Total Assessment is a certain percentage of the fair market value that is determined by local assessors to be the total taxable value of land and additions on the property. | Land | Improvement |
|---|---|---|---|---|
| 2025 | $50,000 | $4,504,500 | $2,359,300 | $2,145,200 |
| 2024 | $49,009 | $4,407,300 | $2,359,300 | $2,048,000 |
| 2023 | $49,610 | $4,190,000 | $2,359,300 | $1,830,700 |
| 2022 | $47,657 | $3,720,300 | $2,140,500 | $1,579,800 |
| 2021 | $3,941 | $3,593,700 | $2,088,900 | $1,504,800 |
| 2020 | $46,107 | $3,593,700 | $2,088,900 | $1,504,800 |
| 2019 | $45,162 | $3,587,100 | $2,088,900 | $1,498,200 |
| 2018 | $4,092 | $3,587,100 | $2,088,900 | $1,498,200 |
| 2017 | $47,569 | $3,836,200 | $2,088,900 | $1,747,300 |
| 2016 | $46,648 | $3,836,200 | $2,088,900 | $1,747,300 |
| 2015 | $45,935 | $3,740,600 | $2,043,300 | $1,697,300 |
Source: Public Records
Map
Nearby Homes