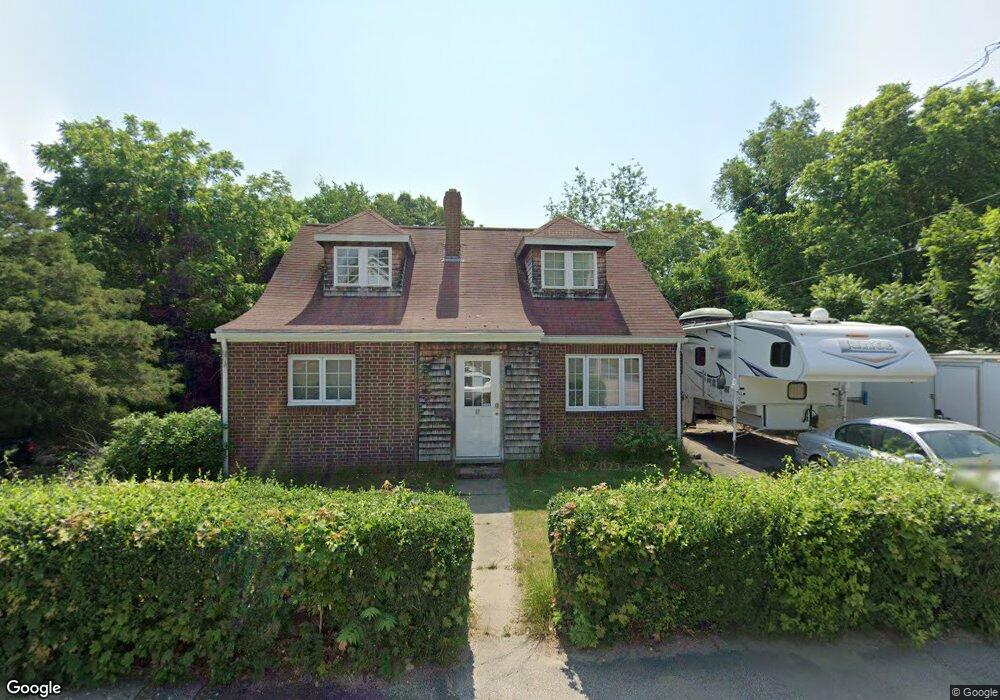
85 Oxford St N Auburn, MA 01501
Stoneville NeighborhoodEstimated Value: $422,000 - $451,699
3
Beds
3
Baths
1,575
Sq Ft
$278/Sq Ft
Est. Value
About This Home
This home is located at 85 Oxford St N, Auburn, MA 01501 and is currently estimated at $437,675, approximately $277 per square foot. 85 Oxford St N is a home located in Worcester County with nearby schools including Auburn Senior High School and Shrewsbury Montessori School - Auburn Campus.
Ownership History
Date
Name
Owned For
Owner Type
Purchase Details
Closed on
Jun 12, 2000
Sold by
Gentile Matteo L
Bought by
Saunders Georgann K
Current Estimated Value
Home Financials for this Owner
Home Financials are based on the most recent Mortgage that was taken out on this home.
Original Mortgage
$62,250
Interest Rate
8.12%
Mortgage Type
Purchase Money Mortgage
Purchase Details
Closed on
May 30, 2000
Sold by
Laprad Cecile Y
Bought by
Gentile Matteo L
Home Financials for this Owner
Home Financials are based on the most recent Mortgage that was taken out on this home.
Original Mortgage
$62,250
Interest Rate
8.12%
Mortgage Type
Purchase Money Mortgage
Create a Home Valuation Report for This Property
The Home Valuation Report is an in-depth analysis detailing your home's value as well as a comparison with similar homes in the area
Home Values in the Area
Average Home Value in this Area
Purchase History
| Date | Buyer | Sale Price | Title Company |
|---|---|---|---|
| Saunders Georgann K | $124,500 | -- | |
| Gentile Matteo L | $135,000 | -- |
Source: Public Records
Mortgage History
| Date | Status | Borrower | Loan Amount |
|---|---|---|---|
| Open | Gentile Matteo L | $86,250 | |
| Closed | Gentile Matteo L | $62,250 | |
| Closed | Gentile Matteo L | $115,000 |
Source: Public Records
Tax History Compared to Growth
Tax History
| Year | Tax Paid | Tax Assessment Tax Assessment Total Assessment is a certain percentage of the fair market value that is determined by local assessors to be the total taxable value of land and additions on the property. | Land | Improvement |
|---|---|---|---|---|
| 2025 | $51 | $359,300 | $111,900 | $247,400 |
| 2024 | $5,163 | $345,800 | $107,600 | $238,200 |
| 2023 | $5,082 | $320,000 | $97,900 | $222,100 |
| 2022 | $4,737 | $281,600 | $97,900 | $183,700 |
| 2021 | $4,547 | $245,800 | $87,000 | $158,800 |
| 2020 | $2,679 | $239,600 | $87,000 | $152,600 |
| 2019 | $4,133 | $224,400 | $81,300 | $143,100 |
| 2018 | $3,919 | $212,500 | $76,000 | $136,500 |
| 2017 | $3,457 | $188,500 | $68,900 | $119,600 |
| 2016 | $3,320 | $183,500 | $71,100 | $112,400 |
| 2015 | $3,153 | $182,700 | $71,100 | $111,600 |
| 2014 | $3,067 | $177,400 | $67,500 | $109,900 |
Source: Public Records
Map
Nearby Homes
- 176 Boyce St
- 177 Boyce St
- 5 Commonwealth Ave
- 25 Vinal St Unit 26
- 25 Vinal St Unit 29
- 25 Vinal St Unit 30
- 8 Shirley St
- 177 Oxford St N
- 2 Keen St
- 4 S Edlin St
- 34 Rockland Rd
- 19-20 Williams St
- 27 Havana Rd
- 53 James St
- 1-9 Helens Way
- 33 Walsh Ave
- 31-33 Walsh Ave
- 31 Walsh Ave
- 35 Genessee St Unit I
- 315 Stafford St