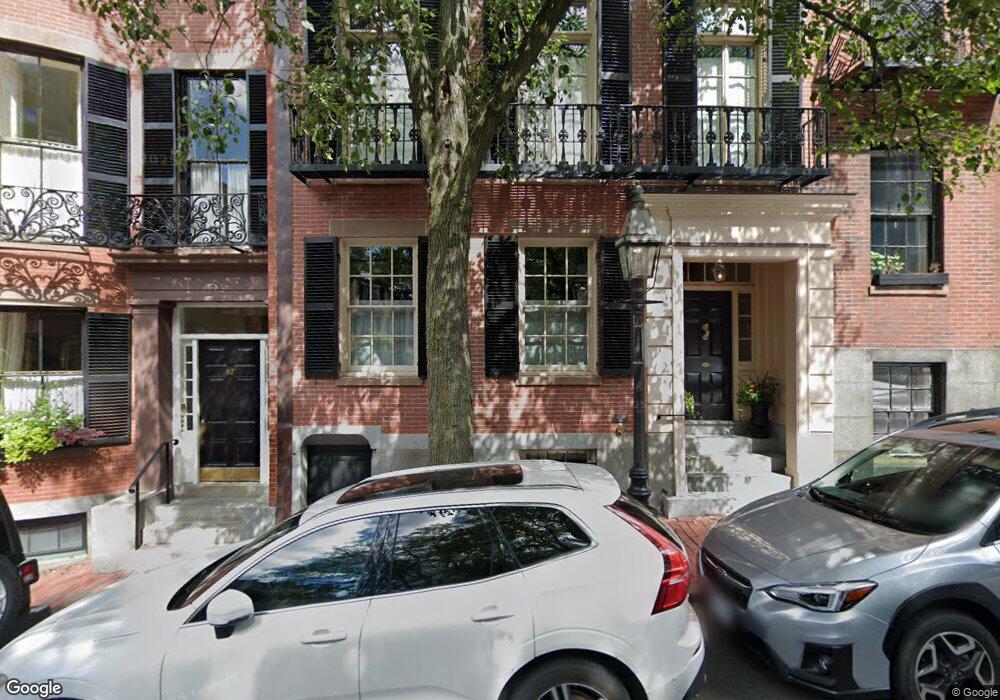
85 Pinckney St Boston, MA 02114
Beacon Hill NeighborhoodEstimated Value: $3,116,000 - $7,430,630
5
Beds
8
Baths
6,998
Sq Ft
$824/Sq Ft
Est. Value
About This Home
This home is located at 85 Pinckney St, Boston, MA 02114 and is currently estimated at $5,763,877, approximately $823 per square foot. 85 Pinckney St is a home located in Suffolk County with nearby schools including Advent School, Torit Montessori School, and Park Street School.
Ownership History
Date
Name
Owned For
Owner Type
Purchase Details
Closed on
Apr 22, 2024
Sold by
Wood Peter J
Bought by
85 Pinckney Street Llc
Current Estimated Value
Purchase Details
Closed on
Oct 31, 1997
Sold by
Pinckney St Rt 85 and Mcquade Joseph L
Bought by
Wood Peter J
Purchase Details
Closed on
Apr 7, 1995
Sold by
Rogers Charles F and Rogers Marga R
Bought by
Pinckney St Rt85 and Mcquade Joseph L
Home Financials for this Owner
Home Financials are based on the most recent Mortgage that was taken out on this home.
Original Mortgage
$747,000
Interest Rate
8.66%
Mortgage Type
Purchase Money Mortgage
Create a Home Valuation Report for This Property
The Home Valuation Report is an in-depth analysis detailing your home's value as well as a comparison with similar homes in the area
Home Values in the Area
Average Home Value in this Area
Purchase History
| Date | Buyer | Sale Price | Title Company |
|---|---|---|---|
| 85 Pinckney Street Llc | -- | None Available | |
| 85 Pinckney Street Llc | -- | None Available | |
| Wood Peter J | $3,925,000 | -- | |
| Wood Peter J | $3,925,000 | -- | |
| Pinckney St Rt85 | $1,447,000 | -- | |
| Pinckney St Rt85 | $1,447,000 | -- |
Source: Public Records
Mortgage History
| Date | Status | Borrower | Loan Amount |
|---|---|---|---|
| Previous Owner | Pinckney St Rt85 | $765,000 | |
| Previous Owner | Pinckney St Rt85 | $747,000 |
Source: Public Records
Tax History Compared to Growth
Tax History
| Year | Tax Paid | Tax Assessment Tax Assessment Total Assessment is a certain percentage of the fair market value that is determined by local assessors to be the total taxable value of land and additions on the property. | Land | Improvement |
|---|---|---|---|---|
| 2025 | $90,834 | $7,844,000 | $2,121,200 | $5,722,800 |
| 2024 | $84,666 | $7,767,500 | $1,964,800 | $5,802,700 |
| 2023 | $83,423 | $7,767,500 | $1,964,800 | $5,802,700 |
| 2022 | $84,510 | $7,767,500 | $1,964,800 | $5,802,700 |
| 2021 | $78,049 | $7,314,800 | $1,871,200 | $5,443,600 |
| 2020 | $68,132 | $6,451,900 | $1,425,400 | $5,026,500 |
| 2019 | $77,439 | $7,347,200 | $1,354,800 | $5,992,400 |
| 2018 | $71,943 | $6,864,800 | $1,354,800 | $5,510,000 |
| 2017 | $68,344 | $6,453,600 | $1,354,800 | $5,098,800 |
| 2016 | $66,406 | $6,036,900 | $1,354,800 | $4,682,100 |
| 2015 | $63,236 | $5,221,800 | $1,146,100 | $4,075,700 |
| 2014 | $58,652 | $4,662,300 | $1,146,100 | $3,516,200 |
Source: Public Records
Map
Nearby Homes
- 101 Pinckney St
- 80 Revere St Unit 1
- 111 Pinckney St Unit 2
- 32 W Cedar St
- 15 W Cedar St
- 64 Revere St
- 59 W Cedar St Unit 6
- 22 Louisburg Square
- 75 Charles St Unit 4B
- 120 Charles St
- 70 Phillips St Unit 3
- 68 Phillips St Unit 4
- 94 Mount Vernon St
- 45 Revere St Unit B
- 11 W Cedar St
- 90 Mount Vernon St
- 39 Revere St Unit 6
- 86 Mount Vernon St
- 140 Charles St Unit 2
- 144 Charles Street Space 2-36
- 85 Pinckney St Unit 1&2
- 87 Pinckney St Unit 4
- 87 Pinckney St Unit 3
- 87 Pinckney St Unit 2
- 87 Pinckney St Unit 1
- 81 Pinckney St
- 89 Pinckney St
- 89 Pinckney St Unit 4-2
- 91 Pinckney St
- 79 Pinckney St
- 118 Myrtle St
- 116 Myrtle St Unit C
- 116 Myrtle St Unit B
- 116 Myrtle St Unit A
- 116 Myrtle St Unit PH1
- 116 Myrtle St
- 116 Myrtle St Unit 4
- 112 Myrtle St Unit B
- 112 Myrtle St
- 112 Myrtle St Unit 5