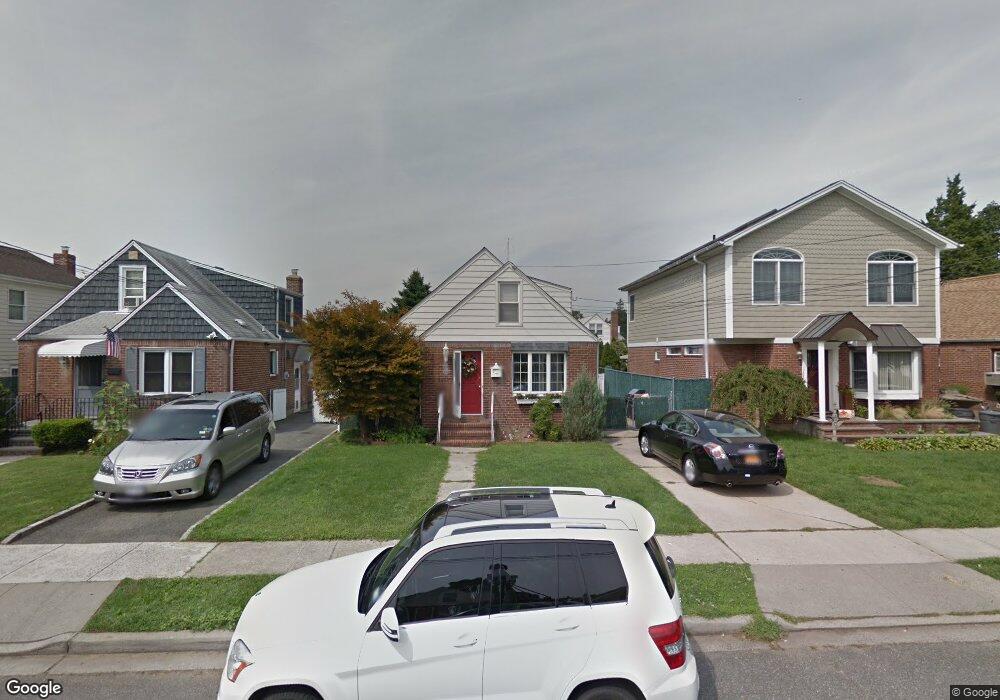
85 Roxbury Rd Franklin Square, NY 11010
Estimated Value: $696,278 - $776,000
4
Beds
2
Baths
1,215
Sq Ft
$606/Sq Ft
Est. Value
About This Home
This home is located at 85 Roxbury Rd, Franklin Square, NY 11010 and is currently estimated at $736,139, approximately $605 per square foot. 85 Roxbury Rd is a home located in Nassau County with nearby schools including The Waldorf School of Garden City.
Ownership History
Date
Name
Owned For
Owner Type
Purchase Details
Closed on
Apr 27, 2017
Sold by
Correra Antonio and Correra Francesco
Bought by
Cherian Giggy T and Giggy Rasmi
Current Estimated Value
Home Financials for this Owner
Home Financials are based on the most recent Mortgage that was taken out on this home.
Original Mortgage
$363,750
Outstanding Balance
$302,834
Interest Rate
4.14%
Mortgage Type
New Conventional
Estimated Equity
$433,305
Purchase Details
Closed on
Dec 23, 2013
Sold by
Correra Frank and Correra Francesco
Bought by
Correra Francesco and Correra Maria
Home Financials for this Owner
Home Financials are based on the most recent Mortgage that was taken out on this home.
Original Mortgage
$304,300
Interest Rate
4.24%
Mortgage Type
Purchase Money Mortgage
Purchase Details
Closed on
Sep 29, 2005
Sold by
Correra Maria
Purchase Details
Closed on
Sep 26, 2005
Sold by
Ruehman Frederik
Bought by
Correra Maria
Purchase Details
Closed on
Oct 23, 2002
Sold by
Ruehman Harriet
Create a Home Valuation Report for This Property
The Home Valuation Report is an in-depth analysis detailing your home's value as well as a comparison with similar homes in the area
Home Values in the Area
Average Home Value in this Area
Purchase History
| Date | Buyer | Sale Price | Title Company |
|---|---|---|---|
| Cherian Giggy T | $485,000 | New Way Abstract Corp | |
| Correra Francesco | -- | -- | |
| -- | -- | -- | |
| Correra Maria | $449,000 | -- | |
| -- | $285,000 | -- |
Source: Public Records
Mortgage History
| Date | Status | Borrower | Loan Amount |
|---|---|---|---|
| Open | Cherian Giggy T | $363,750 | |
| Previous Owner | Correra Francesco | $304,300 |
Source: Public Records
Tax History Compared to Growth
Tax History
| Year | Tax Paid | Tax Assessment Tax Assessment Total Assessment is a certain percentage of the fair market value that is determined by local assessors to be the total taxable value of land and additions on the property. | Land | Improvement |
|---|---|---|---|---|
| 2025 | $8,860 | $403 | $229 | $174 |
| 2024 | $3,744 | $433 | $246 | $187 |
| 2023 | $9,288 | $456 | $259 | $197 |
| 2022 | $9,288 | $455 | $258 | $197 |
| 2021 | $11,472 | $472 | $240 | $232 |
| 2020 | $9,183 | $663 | $509 | $154 |
| 2019 | $10,363 | $663 | $509 | $154 |
| 2018 | $9,838 | $663 | $0 | $0 |
| 2017 | $4,480 | $663 | $509 | $154 |
| 2016 | $7,852 | $663 | $438 | $225 |
| 2015 | $3,222 | $678 | $448 | $230 |
| 2014 | $3,222 | $678 | $448 | $230 |
| 2013 | $3,654 | $770 | $509 | $261 |
Source: Public Records
Map
Nearby Homes
- 109 Caroline Ave
- 146 Caroline Ave
- 644 7th St S
- 715 Iris St
- 775 Roosevelt St
- 676 Sobo Ave
- 217 Wellington Rd S
- 124 Kilburn Rd S
- 233 Roxbury Rd S
- 170 Mckinley Ave
- 56 Fendale St
- 234 Nassau Blvd
- 31 Claflin Blvd
- 175 Dorchester Rd
- 149 Rule St
- 144 Rintin St
- 215 Harrison Ave
- 23 Monroe St
- 304 Kilburn Rd S
- 32 Madison Ave