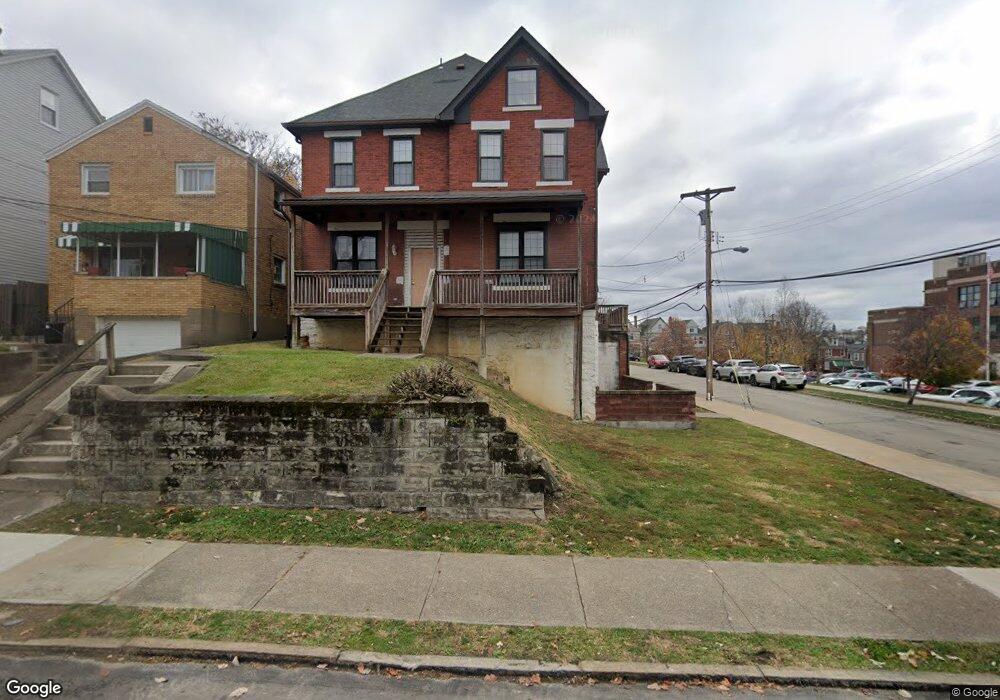
85 Ruth St Pittsburgh, PA 15211
Mount Washington NeighborhoodEstimated Value: $108,000 - $282,000
6
Beds
2
Baths
2,500
Sq Ft
$88/Sq Ft
Est. Value
About This Home
This home is located at 85 Ruth St, Pittsburgh, PA 15211 and is currently estimated at $219,413, approximately $87 per square foot. 85 Ruth St is a home located in Allegheny County with nearby schools including Pittsburgh Whittier K-5, South Hills Middle School, and Pittsburgh Brashear High School.
Ownership History
Date
Name
Owned For
Owner Type
Purchase Details
Closed on
Dec 15, 2021
Sold by
Pokai Bay Properties L L C
Bought by
Mountain View Financial L L C
Current Estimated Value
Purchase Details
Closed on
Oct 19, 2021
Sold by
Pokai Bay Properties Llc
Bought by
Mountain View Financial Llc
Purchase Details
Closed on
Mar 26, 2015
Sold by
Yarsky Ii Exr Kenneth J
Bought by
Pokai Bay Properties Llc
Purchase Details
Closed on
Jul 21, 2000
Sold by
Giaramita Josephine and Giaramita Joseph A
Bought by
Huser Mario
Create a Home Valuation Report for This Property
The Home Valuation Report is an in-depth analysis detailing your home's value as well as a comparison with similar homes in the area
Home Values in the Area
Average Home Value in this Area
Purchase History
| Date | Buyer | Sale Price | Title Company |
|---|---|---|---|
| Mountain View Financial L L C | $95,079 | -- | |
| Mountain View Financial L L C | $95,079 | -- | |
| Mountain View Financial Llc | -- | -- | |
| Pokai Bay Properties Llc | $175,000 | -- | |
| Huser Mario | $43,062 | -- |
Source: Public Records
Tax History Compared to Growth
Tax History
| Year | Tax Paid | Tax Assessment Tax Assessment Total Assessment is a certain percentage of the fair market value that is determined by local assessors to be the total taxable value of land and additions on the property. | Land | Improvement |
|---|---|---|---|---|
| 2025 | $1,781 | $77,300 | $20,500 | $56,800 |
| 2024 | $1,781 | $77,300 | $20,500 | $56,800 |
| 2023 | $1,781 | $77,300 | $20,500 | $56,800 |
| 2022 | $1,758 | $77,300 | $20,500 | $56,800 |
| 2021 | $1,777 | $77,300 | $20,500 | $56,800 |
| 2020 | $1,749 | $77,300 | $20,500 | $56,800 |
| 2019 | $1,749 | $77,300 | $20,500 | $56,800 |
| 2018 | $1,403 | $77,300 | $20,500 | $56,800 |
| 2017 | $1,749 | $77,300 | $20,500 | $56,800 |
| 2016 | $366 | $77,300 | $20,500 | $56,800 |
| 2015 | $366 | $77,300 | $20,500 | $56,800 |
| 2014 | -- | $77,300 | $20,500 | $56,800 |
Source: Public Records
Map
Nearby Homes