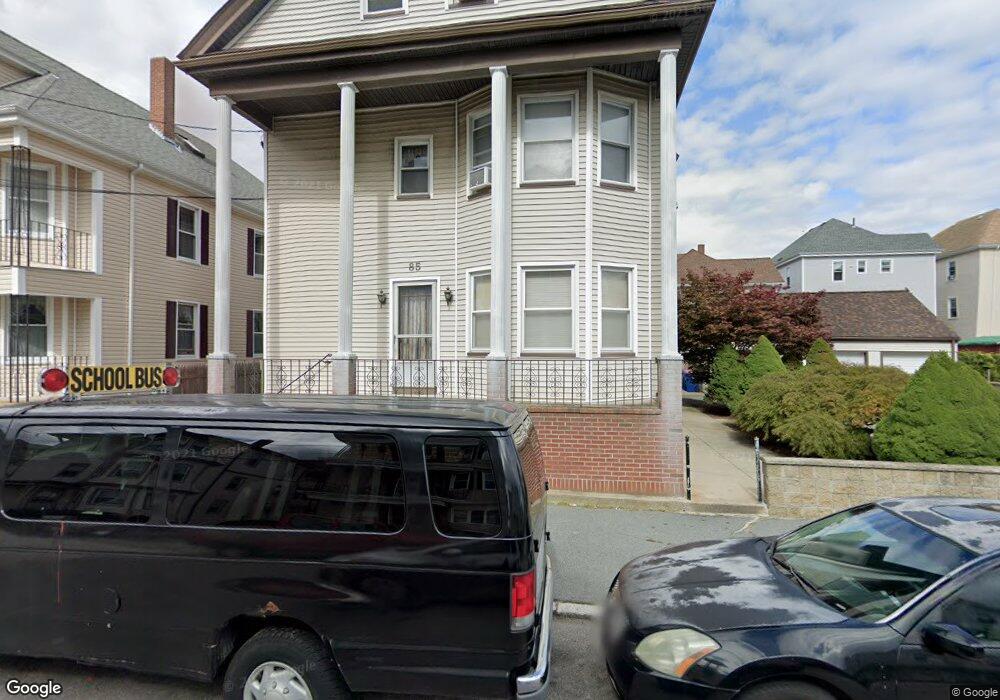
85 Sagamore St New Bedford, MA 02740
The South End NeighborhoodEstimated Value: $624,000 - $655,000
7
Beds
3
Baths
3,180
Sq Ft
$202/Sq Ft
Est. Value
About This Home
This home is located at 85 Sagamore St, New Bedford, MA 02740 and is currently estimated at $643,667, approximately $202 per square foot. 85 Sagamore St is a home located in Bristol County with nearby schools including John B. DeValles Elementary School, Roosevelt Middle School, and New Bedford High School.
Ownership History
Date
Name
Owned For
Owner Type
Purchase Details
Closed on
Oct 4, 1991
Sold by
Mendonca Coite Jr Anthony and Mendonca Shirley A
Bought by
Bandarra Alfred
Current Estimated Value
Purchase Details
Closed on
Sep 15, 1989
Sold by
Mello Steven P
Bought by
Reis Luis
Create a Home Valuation Report for This Property
The Home Valuation Report is an in-depth analysis detailing your home's value as well as a comparison with similar homes in the area
Home Values in the Area
Average Home Value in this Area
Purchase History
| Date | Buyer | Sale Price | Title Company |
|---|---|---|---|
| Bandarra Alfred | $10,000 | -- | |
| Bandarra Alfred | $10,000 | -- | |
| Reis Luis | $165,000 | -- |
Source: Public Records
Mortgage History
| Date | Status | Borrower | Loan Amount |
|---|---|---|---|
| Open | Reis Luis | $150,000 | |
| Closed | Reis Luis | $224,000 | |
| Closed | Reis Luis | $100,000 |
Source: Public Records
Tax History Compared to Growth
Tax History
| Year | Tax Paid | Tax Assessment Tax Assessment Total Assessment is a certain percentage of the fair market value that is determined by local assessors to be the total taxable value of land and additions on the property. | Land | Improvement |
|---|---|---|---|---|
| 2025 | $6,702 | $592,600 | $104,600 | $488,000 |
| 2024 | $5,675 | $472,900 | $100,900 | $372,000 |
| 2023 | $5,320 | $372,300 | $84,400 | $287,900 |
| 2022 | $4,928 | $317,100 | $82,200 | $234,900 |
| 2021 | $4,767 | $305,800 | $78,500 | $227,300 |
| 2020 | $2,970 | $289,700 | $78,500 | $211,200 |
| 2019 | $4,113 | $249,700 | $78,500 | $171,200 |
| 2018 | $2,618 | $233,300 | $78,500 | $154,800 |
| 2017 | $3,597 | $215,500 | $80,300 | $135,200 |
| 2016 | $3,468 | $210,300 | $80,300 | $130,000 |
| 2015 | $3,247 | $206,400 | $80,300 | $126,100 |
| 2014 | $3,129 | $206,400 | $80,300 | $126,100 |
Source: Public Records
Map
Nearby Homes