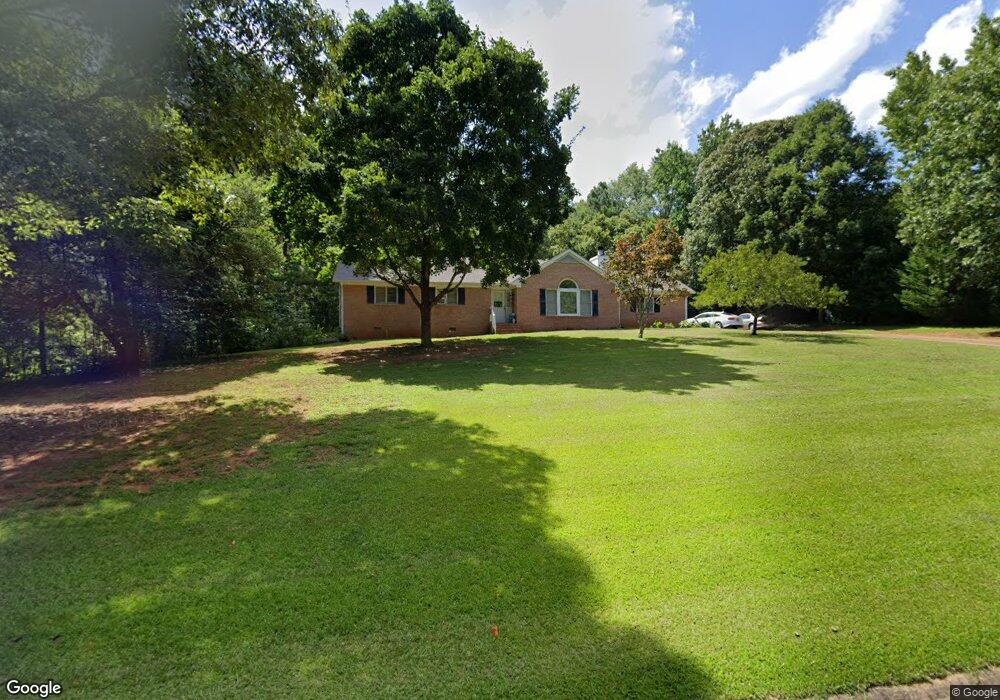
85 Saint Andrews Walk Sharpsburg, GA 30277
Estimated Value: $265,873 - $325,000
3
Beds
2
Baths
1,545
Sq Ft
$185/Sq Ft
Est. Value
About This Home
This home is located at 85 Saint Andrews Walk, Sharpsburg, GA 30277 and is currently estimated at $285,468, approximately $184 per square foot. 85 Saint Andrews Walk is a home located in Coweta County with nearby schools including Canongate Elementary School, Madras Middle School, and Northgate High School.
Ownership History
Date
Name
Owned For
Owner Type
Purchase Details
Closed on
Apr 8, 2021
Sold by
Jones Wanda
Bought by
Bunch Derek
Current Estimated Value
Home Financials for this Owner
Home Financials are based on the most recent Mortgage that was taken out on this home.
Original Mortgage
$140,800
Outstanding Balance
$126,953
Interest Rate
3.05%
Mortgage Type
New Conventional
Estimated Equity
$158,515
Purchase Details
Closed on
Jun 26, 2000
Sold by
Robinson Larry E and Robinson Thomas D
Bought by
Jones Wanda
Home Financials for this Owner
Home Financials are based on the most recent Mortgage that was taken out on this home.
Original Mortgage
$98,160
Interest Rate
8.63%
Mortgage Type
FHA
Purchase Details
Closed on
Apr 10, 2000
Sold by
Robinson Ida Mae
Bought by
Jones Wanda
Purchase Details
Closed on
May 15, 1989
Bought by
Robinson Ida Mae
Create a Home Valuation Report for This Property
The Home Valuation Report is an in-depth analysis detailing your home's value as well as a comparison with similar homes in the area
Home Values in the Area
Average Home Value in this Area
Purchase History
| Date | Buyer | Sale Price | Title Company |
|---|---|---|---|
| Bunch Derek | $176,000 | -- | |
| Jones Wanda | $66,000 | -- | |
| Jones Wanda | -- | -- | |
| Jones Wanda | -- | -- | |
| Robinson Ida Mae | $80,000 | -- |
Source: Public Records
Mortgage History
| Date | Status | Borrower | Loan Amount |
|---|---|---|---|
| Open | Bunch Derek | $140,800 | |
| Previous Owner | Jones Wanda | $98,160 |
Source: Public Records
Tax History Compared to Growth
Tax History
| Year | Tax Paid | Tax Assessment Tax Assessment Total Assessment is a certain percentage of the fair market value that is determined by local assessors to be the total taxable value of land and additions on the property. | Land | Improvement |
|---|---|---|---|---|
| 2025 | $2,119 | $89,694 | $26,000 | $63,694 |
| 2024 | $2,050 | $88,309 | $26,000 | $62,309 |
| 2023 | $2,050 | $80,988 | $22,000 | $58,988 |
| 2022 | $1,734 | $78,172 | $22,000 | $56,172 |
| 2021 | $760 | $71,320 | $18,000 | $53,320 |
| 2020 | $762 | $71,320 | $18,000 | $53,320 |
| 2019 | $969 | $62,033 | $14,000 | $48,033 |
| 2018 | $1,679 | $62,033 | $14,000 | $48,033 |
| 2017 | $1,561 | $58,030 | $14,000 | $44,030 |
| 2016 | $1,423 | $53,847 | $12,000 | $41,847 |
| 2015 | $1,402 | $53,847 | $12,000 | $41,847 |
| 2014 | $1,116 | $44,022 | $12,000 | $32,022 |
Source: Public Records
Map
Nearby Homes
- 11 Line Creek Cir
- 20 Skipton Ct
- 100 Ashland Trail
- 104 Ashland Trail
- 10 Monteray Ct
- 259 Strathmore Dr Unit 3
- 121 Northwoods Rd
- 40 Wenham Ln
- 70 N Strathmore Dr
- 12 Race Point Way
- 110 Kylemore Pass
- 95 Tyler Woods Dr
- 150 Kylemore Pass
- 25 Sycamore Way
- 319 Beaconsfield Dr
- 125 Cannongate Cir
- 131 Cannongate Cir
- 9 Warrior Way
- 100 Clydesdale Ct
- 135 Crimson Ridge
- 75 Saint Andrews Walk
- 75 St Andrews Walk
- 75 St Andrews Way
- 95 Saint Andrews Walk
- 25 Dover Square
- 80 Saint Andrews Walk
- 65 Saint Andrews Walk
- 0 Saint Andrews Walk
- 10 Dover Square
- 90 Saint Andrews Walk
- 70 Saint Andrews Walk
- 20 Cricket Walk
- 35 Dover Square
- 0 Dover Square Unit 3218009
- 0 Dover Square Unit 7172081
- 20 Dover Square
- 55 Saint Andrews Walk
- 105 Saint Andrews Walk
- 60 Saint Andrews Walk
- 30 Cricket Walk