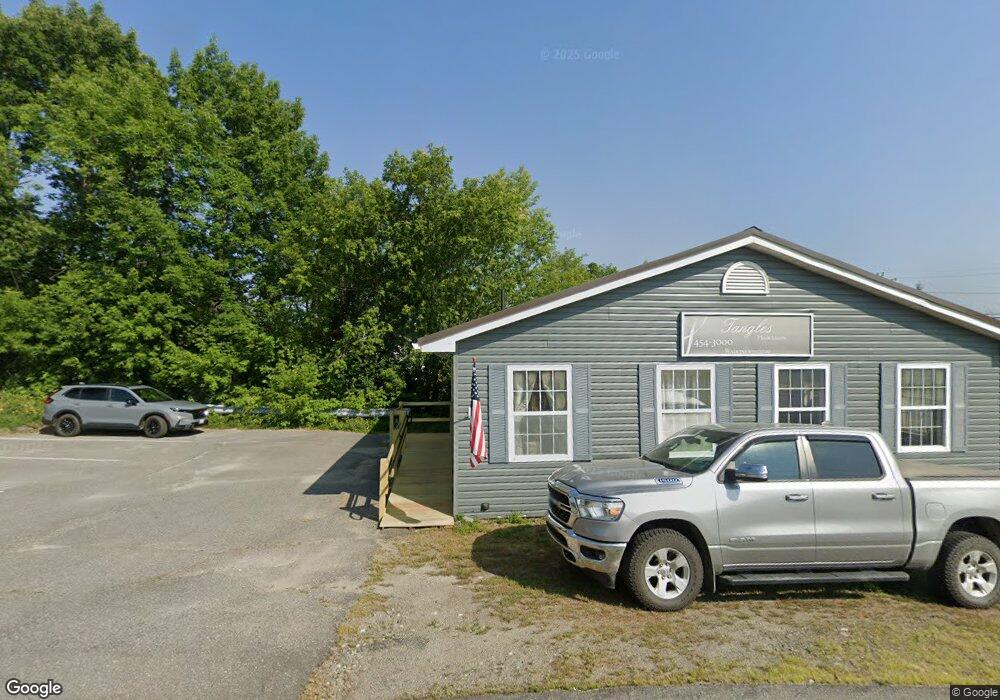
85 Union St Calais, ME 04619
Estimated Value: $182,000 - $251,000
--
Bed
4
Baths
2,802
Sq Ft
$72/Sq Ft
Est. Value
About This Home
This home is located at 85 Union St, Calais, ME 04619 and is currently estimated at $200,858, approximately $71 per square foot. 85 Union St is a home located in Washington County with nearby schools including Calais Elementary School and Calais Middle/High School.
Ownership History
Date
Name
Owned For
Owner Type
Purchase Details
Closed on
Jul 29, 2024
Sold by
Oneill Jeffrey and Oneill Debra
Bought by
Sullivan Garret J
Current Estimated Value
Home Financials for this Owner
Home Financials are based on the most recent Mortgage that was taken out on this home.
Original Mortgage
$135,000
Outstanding Balance
$133,103
Interest Rate
6.87%
Mortgage Type
Purchase Money Mortgage
Estimated Equity
$67,755
Purchase Details
Closed on
Sep 23, 2015
Sold by
Tracy Joan L and Tracy William W
Bought by
Oneill Jeffrey and Oneill Debra
Home Financials for this Owner
Home Financials are based on the most recent Mortgage that was taken out on this home.
Original Mortgage
$92,000
Interest Rate
3.97%
Mortgage Type
New Conventional
Purchase Details
Closed on
Jun 28, 2013
Sold by
Tracy William W and Tracy Joan L
Bought by
Kerr Victor and Kerr Linda
Create a Home Valuation Report for This Property
The Home Valuation Report is an in-depth analysis detailing your home's value as well as a comparison with similar homes in the area
Home Values in the Area
Average Home Value in this Area
Purchase History
| Date | Buyer | Sale Price | Title Company |
|---|---|---|---|
| Sullivan Garret J | $180,000 | None Available | |
| Sullivan Garret J | $180,000 | None Available | |
| Oneill Jeffrey | -- | -- | |
| Kerr Victor | -- | -- | |
| Oneill Jeffrey | -- | -- | |
| Kerr Victor | -- | -- |
Source: Public Records
Mortgage History
| Date | Status | Borrower | Loan Amount |
|---|---|---|---|
| Open | Sullivan Garret J | $135,000 | |
| Closed | Sullivan Garret J | $135,000 | |
| Previous Owner | Oneill Jeffrey | $92,000 |
Source: Public Records
Tax History Compared to Growth
Tax History
| Year | Tax Paid | Tax Assessment Tax Assessment Total Assessment is a certain percentage of the fair market value that is determined by local assessors to be the total taxable value of land and additions on the property. | Land | Improvement |
|---|---|---|---|---|
| 2024 | $2,094 | $139,600 | $14,400 | $125,200 |
| 2023 | $2,047 | $120,400 | $12,400 | $108,000 |
| 2022 | $1,849 | $97,300 | $10,000 | $87,300 |
| 2021 | $2,015 | $93,300 | $9,600 | $83,700 |
| 2020 | $2,019 | $79,800 | $8,200 | $71,600 |
| 2019 | $2,019 | $79,800 | $8,200 | $71,600 |
| 2018 | $2,019 | $79,800 | $8,200 | $71,600 |
| 2017 | $2,019 | $79,800 | $8,200 | $71,600 |
| 2016 | $2,019 | $79,800 | $8,200 | $71,600 |
| 2015 | $2,019 | $79,800 | $8,200 | $71,600 |
| 2014 | $2,019 | $79,800 | $8,200 | $71,600 |
| 2013 | $2,019 | $79,800 | $8,200 | $71,600 |
Source: Public Records
Map
Nearby Homes