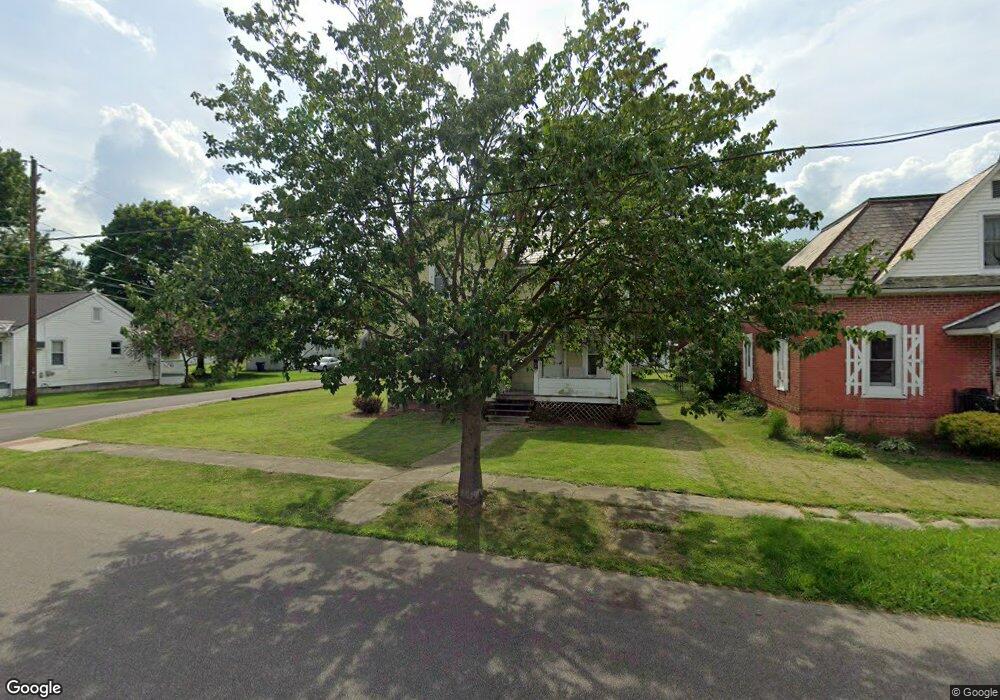
85 Walnut St Shelby, OH 44875
Estimated Value: $66,000 - $110,000
3
Beds
1
Bath
1,466
Sq Ft
$66/Sq Ft
Est. Value
About This Home
This home is located at 85 Walnut St, Shelby, OH 44875 and is currently estimated at $96,827, approximately $66 per square foot. 85 Walnut St is a home located in Richland County with nearby schools including St. Mary's School.
Ownership History
Date
Name
Owned For
Owner Type
Purchase Details
Closed on
Jul 15, 2007
Sold by
Sipes Andrew and Sipes Amy
Bought by
Richland Investment Properties Ltd
Current Estimated Value
Purchase Details
Closed on
Aug 11, 2003
Sold by
Dininger Alan L and Dininger Robert E
Bought by
Sipes Andrew and Sipes Amy
Home Financials for this Owner
Home Financials are based on the most recent Mortgage that was taken out on this home.
Original Mortgage
$20,800
Interest Rate
5.47%
Mortgage Type
Purchase Money Mortgage
Create a Home Valuation Report for This Property
The Home Valuation Report is an in-depth analysis detailing your home's value as well as a comparison with similar homes in the area
Home Values in the Area
Average Home Value in this Area
Purchase History
| Date | Buyer | Sale Price | Title Company |
|---|---|---|---|
| Richland Investment Properties Ltd | -- | None Available | |
| Sipes Andrew | $26,000 | Southern Title |
Source: Public Records
Mortgage History
| Date | Status | Borrower | Loan Amount |
|---|---|---|---|
| Previous Owner | Sipes Andrew | $20,800 |
Source: Public Records
Tax History
| Year | Tax Paid | Tax Assessment Tax Assessment Total Assessment is a certain percentage of the fair market value that is determined by local assessors to be the total taxable value of land and additions on the property. | Land | Improvement |
|---|---|---|---|---|
| 2024 | $822 | $21,000 | $4,310 | $16,690 |
| 2023 | $823 | $21,000 | $4,310 | $16,690 |
| 2022 | $590 | $13,470 | $4,130 | $9,340 |
| 2021 | $590 | $13,470 | $4,130 | $9,340 |
| 2020 | $591 | $13,470 | $4,130 | $9,340 |
| 2019 | $548 | $11,460 | $3,500 | $7,960 |
| 2018 | $543 | $11,460 | $3,500 | $7,960 |
| 2017 | $501 | $11,460 | $3,500 | $7,960 |
| 2016 | $464 | $9,960 | $3,320 | $6,640 |
| 2015 | $464 | $9,960 | $3,320 | $6,640 |
| 2014 | $447 | $9,960 | $3,320 | $6,640 |
| 2012 | $463 | $10,490 | $3,500 | $6,990 |
Source: Public Records
Map
Nearby Homes
Your Personal Tour Guide
Ask me questions while you tour the home.