Estimated Value: $424,000 - $449,000
4
Beds
3
Baths
2,033
Sq Ft
$214/Sq Ft
Est. Value
About This Home
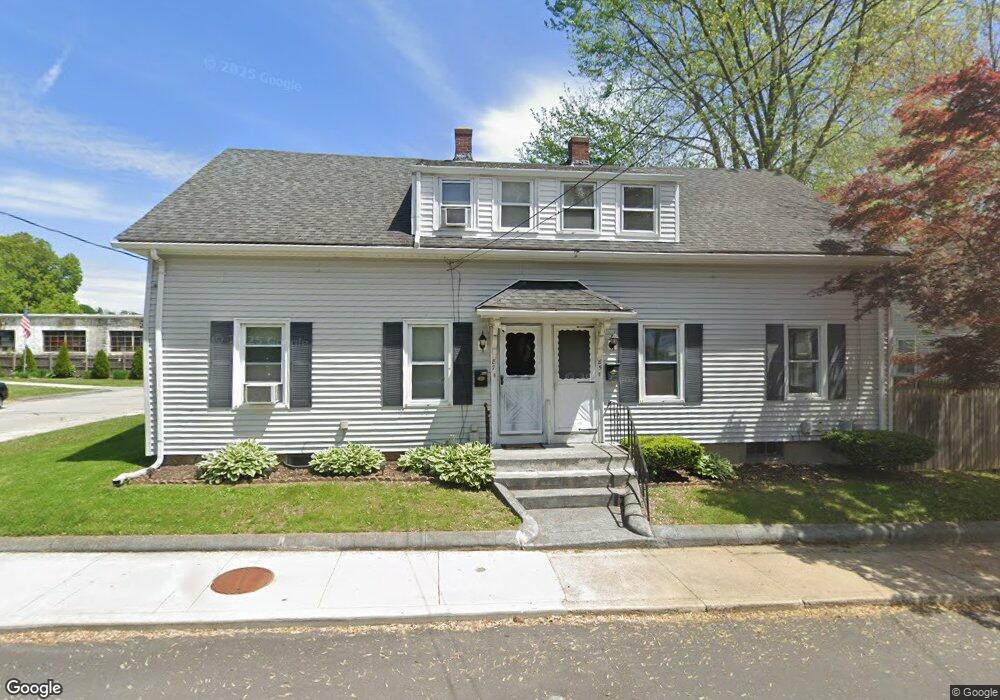
This home is located at 85 West St, West Warwick, RI 02893 and is currently estimated at $434,667, approximately $213 per square foot. 85 West St is a home located in Kent County with nearby schools including West Warwick High School and Islamic School of Rhode Island.
Ownership History
Date
Name
Owned For
Owner Type
Purchase Details
Closed on
Sep 9, 2013
Sold by
Lacroix Roy
Bought by
Roy A Lacroix Rt and Lacroix Roy A
Current Estimated Value
Home Financials for this Owner
Home Financials are based on the most recent Mortgage that was taken out on this home.
Original Mortgage
$99,000
Outstanding Balance
$73,701
Interest Rate
4.34%
Estimated Equity
$360,966
Purchase Details
Closed on
Aug 22, 2011
Sold by
Carr Anne and Sonnicki William
Bought by
Lacroix Roy A
Purchase Details
Closed on
Sep 11, 2009
Sold by
Sosnicki Stanley J Est
Bought by
Sosnicki William S and Dubis Margaret
Create a Home Valuation Report for This Property
The Home Valuation Report is an in-depth analysis detailing your home's value as well as a comparison with similar homes in the area
Home Values in the Area
Average Home Value in this Area
Purchase History
| Date | Buyer | Sale Price | Title Company |
|---|---|---|---|
| Roy A Lacroix Rt | -- | -- | |
| Lacroix Roy A | $70,000 | -- | |
| Sosnicki William S | -- | -- |
Source: Public Records
Mortgage History
| Date | Status | Borrower | Loan Amount |
|---|---|---|---|
| Open | Sosnicki William S | $99,000 | |
| Previous Owner | Sosnicki William S | $644,000 |
Source: Public Records
Tax History Compared to Growth
Tax History
| Year | Tax Paid | Tax Assessment Tax Assessment Total Assessment is a certain percentage of the fair market value that is determined by local assessors to be the total taxable value of land and additions on the property. | Land | Improvement |
|---|---|---|---|---|
| 2025 | $5,183 | $339,000 | $83,900 | $255,100 |
| 2024 | $4,995 | $244,000 | $53,300 | $190,700 |
| 2023 | $4,897 | $244,000 | $53,300 | $190,700 |
| 2022 | $4,819 | $244,000 | $53,300 | $190,700 |
| 2021 | $5,027 | $168,200 | $43,800 | $124,400 |
| 2020 | $5,027 | $168,200 | $43,800 | $124,400 |
| 2019 | $4,932 | $168,200 | $43,800 | $124,400 |
| 2018 | $4,445 | $113,400 | $41,200 | $72,200 |
| 2017 | $4,304 | $113,400 | $41,200 | $72,200 |
| 2016 | $4,226 | $113,400 | $41,200 | $72,200 |
| 2015 | $3,017 | $116,200 | $41,200 | $75,000 |
| 2014 | $1,059 | $116,200 | $41,200 | $75,000 |
Source: Public Records
Map
Nearby Homes