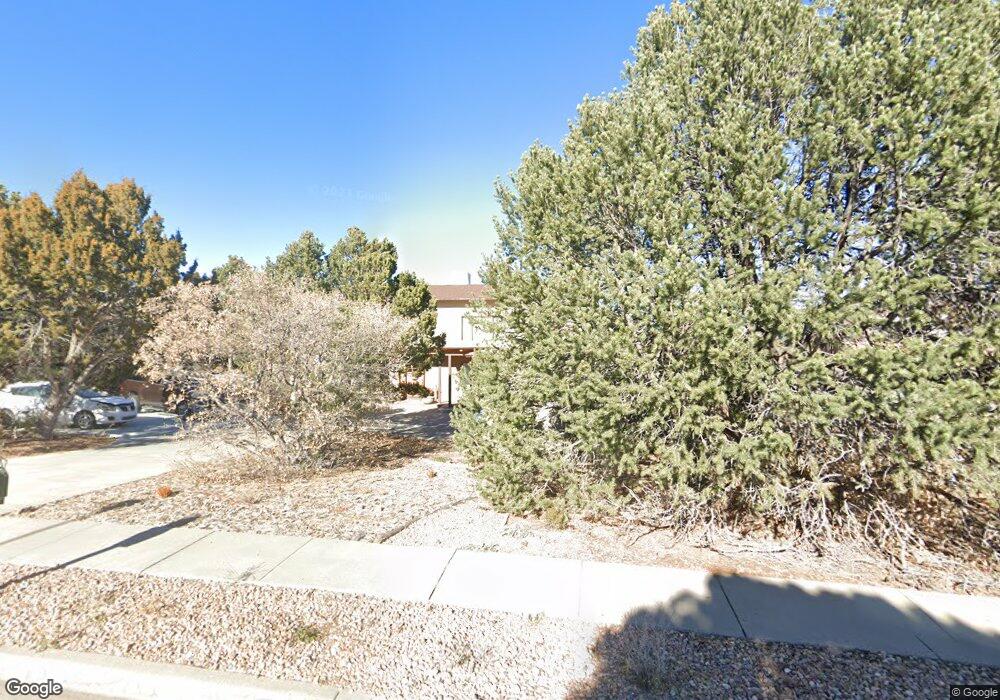
850 Los Pueblos St Los Alamos, NM 87544
Estimated Value: $780,000 - $952,000
5
Beds
3
Baths
3,144
Sq Ft
$271/Sq Ft
Est. Value
About This Home
This home is located at 850 Los Pueblos St, Los Alamos, NM 87544 and is currently estimated at $851,008, approximately $270 per square foot. 850 Los Pueblos St is a home located in Los Alamos County with nearby schools including Barranca Mesa Elementary School, Los Alamos Middle School, and Los Alamos High School.
Ownership History
Date
Name
Owned For
Owner Type
Purchase Details
Closed on
Mar 3, 2025
Sold by
Mooday Rick and Mooday Teddie Sue
Bought by
Rick Mooday And Teddie Sue Mooday Revocable T and Mooday
Current Estimated Value
Purchase Details
Closed on
Sep 23, 2024
Sold by
Mooday Rick and Mooday Teddie Sue
Bought by
Mooday Rick and Mooday Teddie Sue
Purchase Details
Closed on
Jun 1, 2011
Sold by
Liu Lon Chang and Liu Pei Jar
Bought by
Mooday Rick and Mooday Teddie Sue
Home Financials for this Owner
Home Financials are based on the most recent Mortgage that was taken out on this home.
Original Mortgage
$372,000
Interest Rate
3.38%
Mortgage Type
New Conventional
Purchase Details
Closed on
Jan 6, 2011
Sold by
Liu Lon Chang and Liu Pei Jar
Bought by
Liu Lon Chang and Liu Pei Jar
Create a Home Valuation Report for This Property
The Home Valuation Report is an in-depth analysis detailing your home's value as well as a comparison with similar homes in the area
Home Values in the Area
Average Home Value in this Area
Purchase History
| Date | Buyer | Sale Price | Title Company |
|---|---|---|---|
| Rick Mooday And Teddie Sue Mooday Revocable T | -- | None Listed On Document | |
| Mooday Rick | -- | None Listed On Document | |
| Mooday Rick | -- | None Available | |
| Liu Lon Chang | -- | -- |
Source: Public Records
Mortgage History
| Date | Status | Borrower | Loan Amount |
|---|---|---|---|
| Previous Owner | Mooday Rick | $372,000 |
Source: Public Records
Tax History Compared to Growth
Tax History
| Year | Tax Paid | Tax Assessment Tax Assessment Total Assessment is a certain percentage of the fair market value that is determined by local assessors to be the total taxable value of land and additions on the property. | Land | Improvement |
|---|---|---|---|---|
| 2025 | $4,434 | $188,810 | $44,600 | $144,210 |
| 2024 | $4,272 | $183,310 | $43,760 | $139,550 |
| 2023 | $4,224 | $177,970 | $42,990 | $134,980 |
| 2022 | $4,126 | $172,790 | $42,420 | $130,370 |
| 2021 | $3,991 | $167,750 | $41,870 | $125,880 |
| 2020 | $3,946 | $162,870 | $41,380 | $121,490 |
| 2019 | $3,890 | $158,130 | $40,770 | $117,360 |
| 2018 | $3,801 | $153,530 | $40,410 | $113,120 |
| 2017 | $3,761 | $149,050 | $41,520 | $107,530 |
| 2016 | $3,527 | $144,710 | $41,520 | $103,190 |
| 2015 | $3,433 | $140,510 | $44,720 | $95,790 |
| 2014 | $3,081 | $136,420 | $44,720 | $91,700 |
| 2013 | $3,125 | $141,690 | $48,610 | $93,080 |
| 2011 | $3,065 | $144,280 | $50,110 | $94,170 |
Source: Public Records
Map
Nearby Homes
- 585 Navajo Rd
- 10 Tesuque St
- 1705 Los Pueblos St
- 1890 Los Pueblos St
- 1276 Cheyenne St
- 1083 Cheyenne St
- 1015 Alamo Rd
- 945 San Ildefonso Rd Unit 16
- 964 Tsankawi St
- 972 Alamo Rd
- 917 Estates Dr
- 10 Terry Ln
- 435 Camino Cereza
- 1984 Camino Manzana
- 445 Rim Rd
- 1332 La Mirada Cir
- 2176 La Tierra Rd
- 1970 Camino Redondo
- 1071 Pinon Loop
- 1300 Iris St Unit 101
- 880 Los Pueblos St
- 820 Los Pueblos St
- 865 Los Pueblos St
- 835 Los Pueblos St
- 910 Los Pueblos St
- 790 Los Pueblos St
- 895 Los Pueblos St
- 805 Los Pueblos St
- 760 Los Pueblos St
- 940 Los Pueblos St
- 925 Los Pueblos St
- 775 Los Pueblos St
- 730 Los Pueblos St
- 955 Los Pueblos St
- 970 Los Pueblos St
- 700 Los Pueblos St
- 985 Los Pueblos St
- 1000 Los Pueblos St
- 690 Los Pueblos St
- 1030 Los Pueblos St