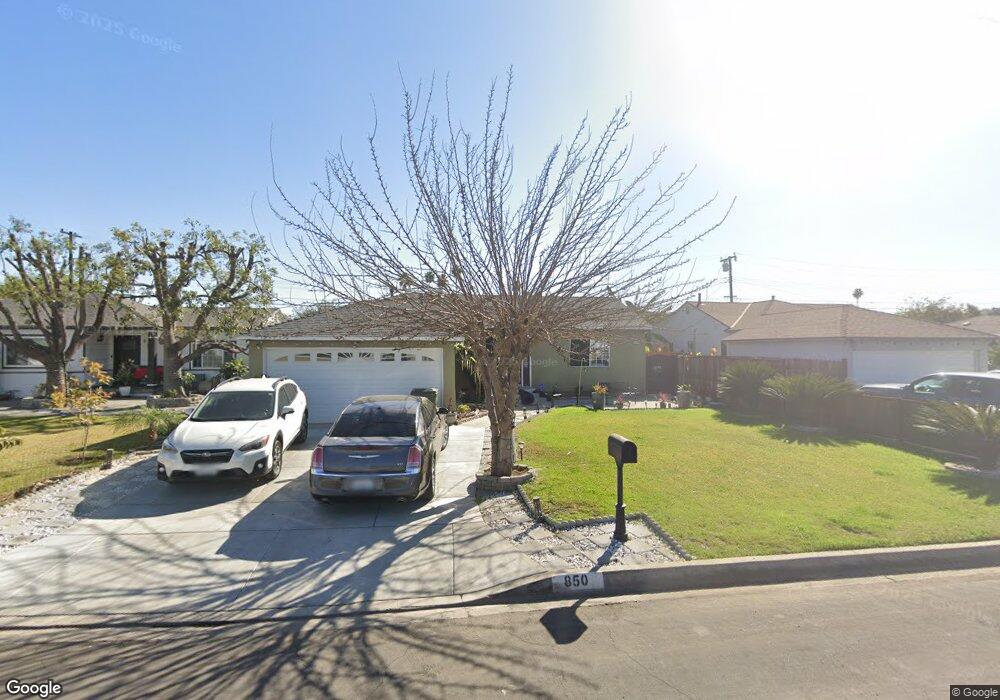
850 Radway Ave La Puente, CA 91744
West Puente Valley NeighborhoodEstimated Value: $694,397 - $746,000
3
Beds
2
Baths
1,073
Sq Ft
$677/Sq Ft
Est. Value
About This Home
This home is located at 850 Radway Ave, La Puente, CA 91744 and is currently estimated at $726,349, approximately $676 per square foot. 850 Radway Ave is a home located in Los Angeles County with nearby schools including Sparks Middle School, La Puente High School, and Hillside Baptist Academy.
Ownership History
Date
Name
Owned For
Owner Type
Purchase Details
Closed on
Jun 11, 2004
Sold by
Torres Peter B and Torres Irene E
Bought by
Torres Peter B and Torres Carmen B
Current Estimated Value
Home Financials for this Owner
Home Financials are based on the most recent Mortgage that was taken out on this home.
Original Mortgage
$75,000
Interest Rate
6.09%
Mortgage Type
Credit Line Revolving
Purchase Details
Closed on
Aug 13, 1997
Sold by
Colonial Home Loan
Bought by
Torres Peter V and Torres Irene E
Home Financials for this Owner
Home Financials are based on the most recent Mortgage that was taken out on this home.
Original Mortgage
$134,407
Outstanding Balance
$19,951
Interest Rate
7.43%
Mortgage Type
FHA
Estimated Equity
$706,398
Purchase Details
Closed on
Jul 18, 1997
Sold by
Palmer Oscar F and Palmer Trust
Bought by
Colonial Home Loan
Home Financials for this Owner
Home Financials are based on the most recent Mortgage that was taken out on this home.
Original Mortgage
$134,407
Outstanding Balance
$19,951
Interest Rate
7.43%
Mortgage Type
FHA
Estimated Equity
$706,398
Create a Home Valuation Report for This Property
The Home Valuation Report is an in-depth analysis detailing your home's value as well as a comparison with similar homes in the area
Home Values in the Area
Average Home Value in this Area
Purchase History
| Date | Buyer | Sale Price | Title Company |
|---|---|---|---|
| Torres Peter B | -- | Chicago Title Insurance Co | |
| Torres Peter V | $136,000 | California Counties Title Co | |
| Colonial Home Loan | $80,000 | California Counties Title Co |
Source: Public Records
Mortgage History
| Date | Status | Borrower | Loan Amount |
|---|---|---|---|
| Closed | Torres Peter B | $75,000 | |
| Open | Torres Peter V | $134,407 |
Source: Public Records
Tax History Compared to Growth
Tax History
| Year | Tax Paid | Tax Assessment Tax Assessment Total Assessment is a certain percentage of the fair market value that is determined by local assessors to be the total taxable value of land and additions on the property. | Land | Improvement |
|---|---|---|---|---|
| 2025 | $3,272 | $241,095 | $101,377 | $139,718 |
| 2024 | $3,272 | $236,369 | $99,390 | $136,979 |
| 2023 | $3,191 | $231,736 | $97,442 | $134,294 |
| 2022 | $3,101 | $227,193 | $95,532 | $131,661 |
| 2021 | $3,043 | $222,739 | $93,659 | $129,080 |
| 2019 | $2,960 | $216,134 | $90,882 | $125,252 |
| 2018 | $2,846 | $211,897 | $89,100 | $122,797 |
| 2016 | $2,641 | $203,671 | $85,641 | $118,030 |
| 2015 | $2,592 | $200,613 | $84,355 | $116,258 |
| 2014 | $2,556 | $196,684 | $82,703 | $113,981 |
Source: Public Records
Map
Nearby Homes
- 932 Shadydale Ave
- 822 Greenberry Dr
- 750 Glenshaw Dr
- 14612 Hutchcroft St
- 829 Foxworth Ave
- 14421 Flynn St
- 736 Tonopah Ave
- 14972 Giordano St
- 1828 Stargaze Dr
- 1260 Greenberry Dr
- 1528 W Delvale St
- 14940 Beckner St
- 544 N Orange Ave Unit B
- 1544 Evanwood Ave
- 357 Cadbrook Dr
- 1329 N Stimson Ave
- 15246 Temple Ave
- 1358 N Stimson Ave
- 610 Willow Ave
- 15416 Giordano St
- 844 Radway Ave
- 856 Radway Ave
- 851 Broadmoor Ave
- 840 Radway Ave
- 862 Radway Ave
- 857 Broadmoor Ave
- 847 Broadmoor Ave
- 841 Broadmoor Ave
- 851 Radway Ave
- 863 Broadmoor Ave
- 834 Radway Ave
- 847 Radway Ave
- 857 Radway Ave
- 841 Radway Ave
- 863 Radway Ave
- 835 Broadmoor Ave
- 828 Radway Ave
- 835 Radway Ave
- 829 Broadmoor Ave
- 850 Broadmoor Ave