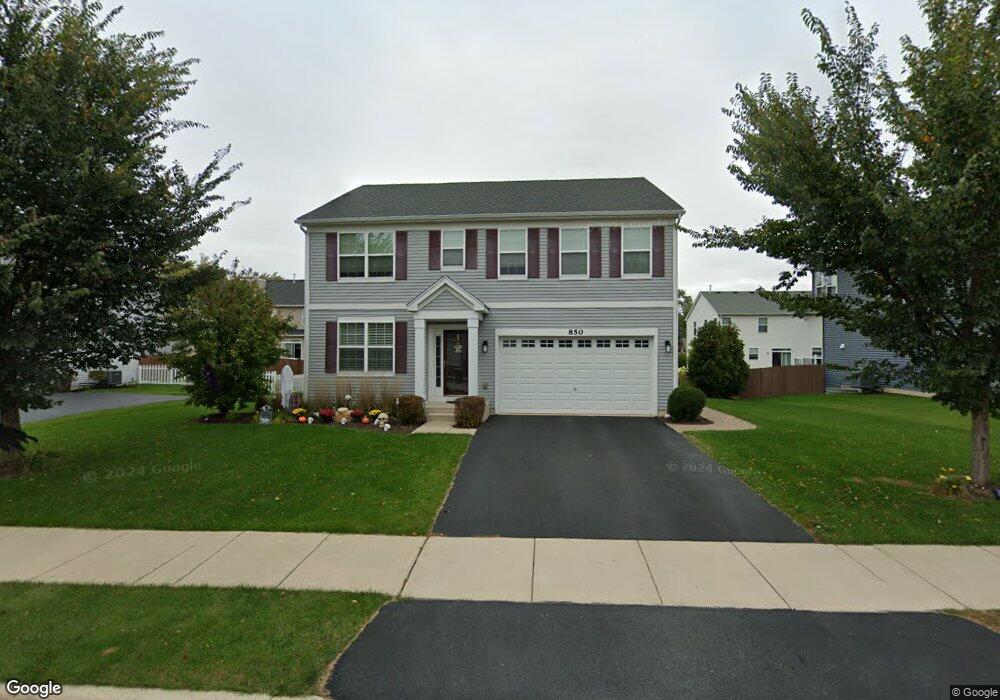
850 Tall Grass Ln Mundelein, IL 60060
Estimated Value: $440,713 - $527,000
3
Beds
3
Baths
2,412
Sq Ft
$195/Sq Ft
Est. Value
About This Home
This home is located at 850 Tall Grass Ln, Mundelein, IL 60060 and is currently estimated at $469,428, approximately $194 per square foot. 850 Tall Grass Ln is a home with nearby schools including Washington Early Learning Center, Mechanics Grove Elementary School, and Carl Sandburg Middle School.
Ownership History
Date
Name
Owned For
Owner Type
Purchase Details
Closed on
Nov 22, 2011
Sold by
K Hovnanian T & C Homes At Illinois L L C
Bought by
Kanches Christopher and Reveland Christie
Current Estimated Value
Home Financials for this Owner
Home Financials are based on the most recent Mortgage that was taken out on this home.
Original Mortgage
$286,683
Outstanding Balance
$197,648
Interest Rate
4.25%
Mortgage Type
FHA
Estimated Equity
$271,780
Purchase Details
Closed on
Feb 21, 2011
Sold by
Tall Grass Ridge Llc
Bought by
Bel Air Investments Inc
Purchase Details
Closed on
Feb 18, 2011
Sold by
Bel Air Investments Inc
Bought by
K Hovnanian T & C Homes At Illinois L L C
Create a Home Valuation Report for This Property
The Home Valuation Report is an in-depth analysis detailing your home's value as well as a comparison with similar homes in the area
Home Values in the Area
Average Home Value in this Area
Purchase History
| Date | Buyer | Sale Price | Title Company |
|---|---|---|---|
| Kanches Christopher | $294,500 | Chicago Title Insurance Co | |
| Bel Air Investments Inc | $1,400,000 | Ct | |
| K Hovnanian T & C Homes At Illinois L L C | $1,665,000 | None Available |
Source: Public Records
Mortgage History
| Date | Status | Borrower | Loan Amount |
|---|---|---|---|
| Open | Kanches Christopher | $286,683 |
Source: Public Records
Tax History Compared to Growth
Tax History
| Year | Tax Paid | Tax Assessment Tax Assessment Total Assessment is a certain percentage of the fair market value that is determined by local assessors to be the total taxable value of land and additions on the property. | Land | Improvement |
|---|---|---|---|---|
| 2024 | $10,587 | $117,534 | $29,164 | $88,370 |
| 2023 | $10,893 | $107,691 | $26,722 | $80,969 |
| 2022 | $10,893 | $107,253 | $26,118 | $81,135 |
| 2021 | $10,421 | $103,496 | $25,203 | $78,293 |
| 2020 | $10,254 | $100,647 | $24,509 | $76,138 |
| 2019 | $9,927 | $97,337 | $23,703 | $73,634 |
| 2018 | $10,459 | $102,123 | $24,810 | $77,313 |
| 2017 | $10,328 | $98,908 | $24,029 | $74,879 |
| 2016 | $10,068 | $93,939 | $22,822 | $71,117 |
| 2015 | $9,825 | $88,065 | $21,395 | $66,670 |
| 2014 | $9,634 | $87,956 | $21,207 | $66,749 |
| 2012 | $9,249 | $88,737 | $21,395 | $67,342 |
Source: Public Records
Map
Nearby Homes
- 116 S Pershing Ave
- 207 N Idlewild Ave
- 1297 Spalding Dr
- 1305 Spalding Dr
- 250 N Fairlawn Ave
- 201 Bingham Cir
- 208 Bingham Cir
- 26980 N Pierre Dr
- 19925 W Il Route 60
- 26220 N Midlothian Rd
- 123 Dunton Ct
- 26892 N Iride Dr
- 1360 Edington Ln
- 29746 U S 45
- 547 N Ridgemoor Ave
- 19738 W Martin Dr
- 851 Glenview Ave
- 619 N California Ave Unit 1
- 26642 N Il Route 83
- 728 W Maple Ave
- 856 Tall Grass Ln
- 844 Tall Grass Ln
- 843 W Courtland St
- 833 W Courtland St
- 849 Tall Grass Ln
- 855 Tall Grass Ln
- 838 Tall Grass Ln
- 862 Tall Grass Ln
- 843 Tall Grass Ln
- 863 W Courtland St
- 823 W Courtland St
- 837 Tall Grass Ln
- 868 Tall Grass Ln
- 832 Tall Grass Ln
- 867 Tall Grass Ln
- 3102 Marshall Ln
- 3 N Ridgemoor Ave
- 873 W Courtland St