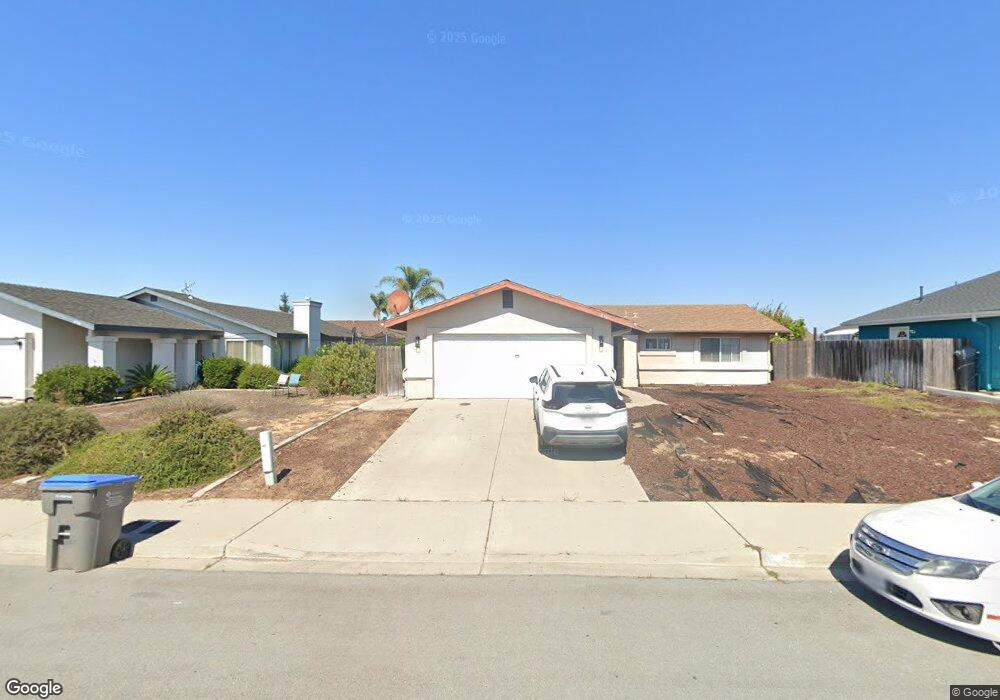
850 Tanis Place Unit LOT Nipomo, CA 93444
Estimated Value: $657,077 - $714,000
3
Beds
2
Baths
1,200
Sq Ft
$574/Sq Ft
Est. Value
About This Home
This home is located at 850 Tanis Place Unit LOT, Nipomo, CA 93444 and is currently estimated at $688,769, approximately $573 per square foot. 850 Tanis Place Unit LOT is a home located in San Luis Obispo County with nearby schools including Dana Elementary School, Mesa Middle School, and Nipomo High School.
Ownership History
Date
Name
Owned For
Owner Type
Purchase Details
Closed on
Jun 9, 2025
Sold by
Johnson Mack
Bought by
Watkins Olga E
Current Estimated Value
Home Financials for this Owner
Home Financials are based on the most recent Mortgage that was taken out on this home.
Original Mortgage
$314,000
Outstanding Balance
$313,194
Interest Rate
6.81%
Mortgage Type
New Conventional
Estimated Equity
$375,575
Purchase Details
Closed on
Jun 19, 1998
Sold by
Little Carolyn A
Bought by
Watkins Olga E
Home Financials for this Owner
Home Financials are based on the most recent Mortgage that was taken out on this home.
Original Mortgage
$25,000
Interest Rate
6.9%
Mortgage Type
Stand Alone Second
Purchase Details
Closed on
Nov 20, 1997
Sold by
The Exchange Group Inc
Bought by
Watkins Olga E and Little Carolyn A
Home Financials for this Owner
Home Financials are based on the most recent Mortgage that was taken out on this home.
Original Mortgage
$107,950
Interest Rate
4.95%
Create a Home Valuation Report for This Property
The Home Valuation Report is an in-depth analysis detailing your home's value as well as a comparison with similar homes in the area
Home Values in the Area
Average Home Value in this Area
Purchase History
| Date | Buyer | Sale Price | Title Company |
|---|---|---|---|
| Watkins Olga E | -- | Stewart Title Guaranty Company | |
| Watkins Olga E | -- | First American Title Ins Co | |
| Watkins Olga E | $135,000 | Fidelity National Title Co |
Source: Public Records
Mortgage History
| Date | Status | Borrower | Loan Amount |
|---|---|---|---|
| Open | Watkins Olga E | $314,000 | |
| Previous Owner | Watkins Olga E | $25,000 | |
| Previous Owner | Watkins Olga E | $107,950 |
Source: Public Records
Tax History Compared to Growth
Tax History
| Year | Tax Paid | Tax Assessment Tax Assessment Total Assessment is a certain percentage of the fair market value that is determined by local assessors to be the total taxable value of land and additions on the property. | Land | Improvement |
|---|---|---|---|---|
| 2025 | $2,234 | $215,470 | $95,771 | $119,699 |
| 2024 | $2,209 | $211,246 | $93,894 | $117,352 |
| 2023 | $2,209 | $207,104 | $92,053 | $115,051 |
| 2022 | $2,176 | $203,045 | $90,249 | $112,796 |
| 2021 | $2,172 | $199,065 | $88,480 | $110,585 |
| 2020 | $2,147 | $197,025 | $87,573 | $109,452 |
| 2019 | $2,134 | $193,162 | $85,856 | $107,306 |
| 2018 | $2,109 | $189,375 | $84,173 | $105,202 |
| 2017 | $2,070 | $185,663 | $82,523 | $103,140 |
| 2016 | $1,953 | $182,023 | $80,905 | $101,118 |
| 2015 | $1,926 | $179,290 | $79,690 | $99,600 |
| 2014 | $1,855 | $175,778 | $78,129 | $97,649 |
Source: Public Records
Map
Nearby Homes
- 719 W Tefft St
- 759 Viola Ct
- 680 Hill St
- Mesa Plan at Hill Street Terraces - Hill Street Series
- Pacific Plan at Hill Street Terraces - Hill Street Series
- Monarch Plan at Hill Street Terraces - Hill Street Series
- Rancho Plan at Hill Street Terraces - Hill Street Series
- Dana Plan at Hill Street Terraces - Hill Street Series
- 232 Scarlett Cir
- 217 Hope Way
- 219 Lema Dr
- 231 Trevino Dr
- 261 Hazel Ln
- 228 Chaparral Ln
- 875 Camino Caballo
- 483 Violet Ave
- 255 Encino Ln
- 522 Higos Way
- 457 Polaris Dr
- 426 Polaris Dr
- 850 Tanis Place
- 844 Tanis Place Unit LOT
- 844 Tanis Place
- 856 Tanis Place Unit LOT
- 36 Chata St Unit LOT
- 861 Bernita Place
- 859 Bernita Place
- 862 Tanis Place Unit LOT
- 862 Tanis Place
- 838 Tanis Place Unit LOT
- 838 Tanis Place
- 863 Bernita Place
- 898 Chata St
- 865 Bernita Place
- 868 Tanis Place Unit LOT
- 868 Tanis Place
- 894 Chata St
- 150 Elvira Way Unit LOT