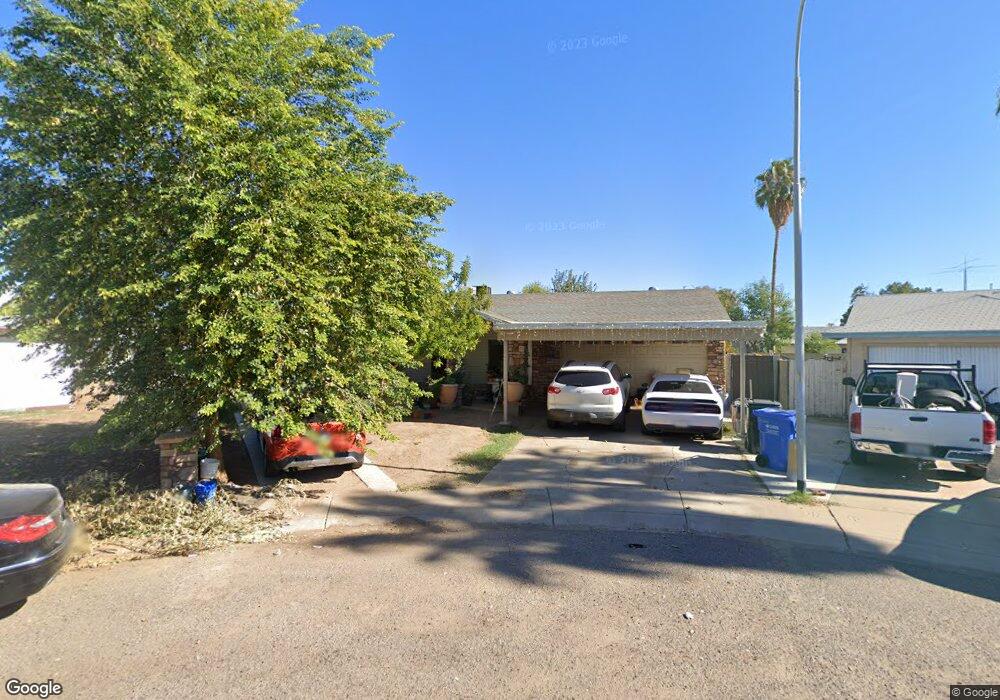
8502 W Fairmount Ave Phoenix, AZ 85037
Estimated Value: $292,000 - $378,000
4
Beds
2
Baths
1,800
Sq Ft
$191/Sq Ft
Est. Value
About This Home
This home is located at 8502 W Fairmount Ave, Phoenix, AZ 85037 and is currently estimated at $343,478, approximately $190 per square foot. 8502 W Fairmount Ave is a home located in Maricopa County with nearby schools including Desert Horizon Elementary School, Copper Canyon High School, and Acclaim Academy.
Ownership History
Date
Name
Owned For
Owner Type
Purchase Details
Closed on
Jun 11, 2014
Sold by
Montes Violeta
Bought by
Montes Jose R Loya
Current Estimated Value
Home Financials for this Owner
Home Financials are based on the most recent Mortgage that was taken out on this home.
Original Mortgage
$104,000
Outstanding Balance
$32,365
Interest Rate
4.17%
Mortgage Type
New Conventional
Estimated Equity
$311,113
Purchase Details
Closed on
Feb 2, 2004
Sold by
Satovich Gary and Satovich Dianne
Bought by
Sanchez Octaviano and Sanchez Irma
Home Financials for this Owner
Home Financials are based on the most recent Mortgage that was taken out on this home.
Original Mortgage
$117,900
Interest Rate
5.61%
Mortgage Type
New Conventional
Purchase Details
Closed on
Oct 29, 2003
Sold by
Welker Laurel A
Bought by
Satovich Gary and Satovich Diane
Purchase Details
Closed on
Jun 16, 1994
Sold by
First Union Home Equity Corp
Bought by
Welker Laurel A
Create a Home Valuation Report for This Property
The Home Valuation Report is an in-depth analysis detailing your home's value as well as a comparison with similar homes in the area
Purchase History
| Date | Buyer | Sale Price | Title Company |
|---|---|---|---|
| Montes Jose R Loya | -- | Driggs Title Agency Inc | |
| Montes Jose R Loya | $130,000 | Driggs Title Agency Inc | |
| Sanchez Octaviano | $131,000 | Lawyers Title Insurance Corp | |
| Satovich Gary | $94,100 | Lawyers Title Insurance Corp | |
| Welker Laurel A | -- | Grand Canyon Title Agency |
Source: Public Records
Mortgage History
| Date | Status | Borrower | Loan Amount |
|---|---|---|---|
| Open | Montes Jose R Loya | $104,000 | |
| Closed | Montes Jose R Loya | $104,000 | |
| Previous Owner | Sanchez Octaviano | $117,900 |
Source: Public Records
Tax History
| Year | Tax Paid | Tax Assessment Tax Assessment Total Assessment is a certain percentage of the fair market value that is determined by local assessors to be the total taxable value of land and additions on the property. | Land | Improvement |
|---|---|---|---|---|
| 2025 | $1,188 | $8,128 | -- | -- |
| 2024 | $1,075 | $7,741 | -- | -- |
| 2023 | $1,075 | $25,200 | $5,040 | $20,160 |
| 2022 | $1,032 | $20,030 | $4,000 | $16,030 |
| 2021 | $992 | $18,160 | $3,630 | $14,530 |
| 2020 | $962 | $16,720 | $3,340 | $13,380 |
| 2019 | $955 | $14,850 | $2,970 | $11,880 |
| 2018 | $896 | $13,520 | $2,700 | $10,820 |
| 2017 | $836 | $11,450 | $2,290 | $9,160 |
| 2016 | $765 | $9,750 | $1,950 | $7,800 |
| 2015 | $744 | $8,720 | $1,740 | $6,980 |
Source: Public Records
Map
Nearby Homes
- 8533 W Indianola Ave
- 8524 W Weldon Ave
- 3630 N 86th Ave
- 8531 W Vale Dr
- 8332 W Indianola Ave
- 3470 N 98th Ln
- 8414 W Monterosa St
- 8243 W Piccadilly Rd
- 8219 W Piccadilly Rd
- 8316 W Devonshire Ave
- 8151 W Clarendon Ave
- 8313 W Mulberry Dr
- 4119 N 88th Ave
- 3829 N 81st Ave
- 8652 W Heatherbrae Dr
- 4006 N 88th Ln
- 4318 N 85th Ave
- 8117 W Whitton Ave
- 3854 N 89th Ave
- 8834 W Osborn Rd
- 8506 W Fairmount Ave
- 3824 N 84th Ln
- 8501 W Fairmount Ave
- 3828 N 84th Ln
- 8441 W Piccadilly Rd
- 8447 W Piccadilly Rd
- 3820 N 84th Ln
- 3832 N 84th Ln
- 8505 W Fairmount Ave
- 8512 W Fairmount Ave
- 3816 N 84th Ln
- 8511 W Fairmount Ave
- 8501 W Piccadilly Rd
- 8506 W Indianola Ave
- 8518 W Fairmount Ave
- 8502 W Indianola Ave
- 3823 N 84th Ln
- 3827 N 84th Ln
- 3812 N 84th Ln
- 3819 N 84th Ln Unit 6
Your Personal Tour Guide
Ask me questions while you tour the home.