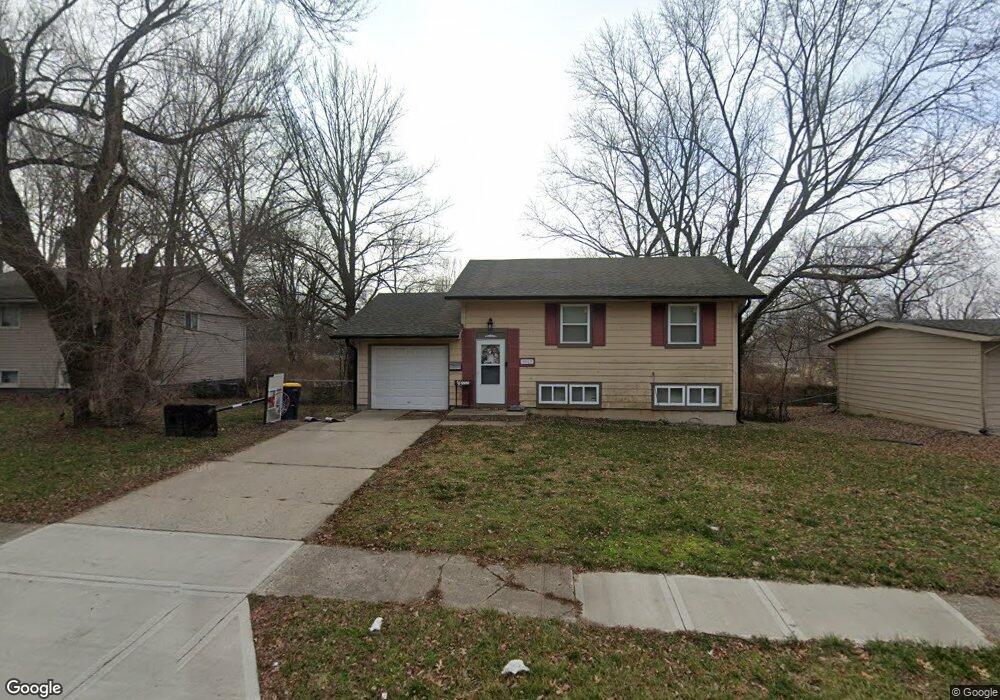
8503 E 91st St Unit 1 Kansas City, MO 64138
Fairwood & Robandee NeighborhoodEstimated Value: $160,000 - $176,000
3
Beds
2
Baths
756
Sq Ft
$219/Sq Ft
Est. Value
About This Home
This home is located at 8503 E 91st St Unit 1, Kansas City, MO 64138 and is currently estimated at $165,199, approximately $218 per square foot. 8503 E 91st St Unit 1 is a home located in Jackson County with nearby schools including Dobbs Elementary School, St Regis School, and Islamic School of Greater Kansas City.
Ownership History
Date
Name
Owned For
Owner Type
Purchase Details
Closed on
Jul 17, 2018
Sold by
Rose Alisha and Rose Marqus
Bought by
Owens Jasmine
Current Estimated Value
Home Financials for this Owner
Home Financials are based on the most recent Mortgage that was taken out on this home.
Original Mortgage
$99,170
Outstanding Balance
$85,946
Interest Rate
4.5%
Mortgage Type
FHA
Estimated Equity
$79,253
Purchase Details
Closed on
May 21, 2010
Sold by
Bred & C Llc
Bought by
Rose Alisha
Home Financials for this Owner
Home Financials are based on the most recent Mortgage that was taken out on this home.
Original Mortgage
$73,904
Interest Rate
4.87%
Mortgage Type
FHA
Purchase Details
Closed on
Nov 11, 2009
Sold by
Deutsche Bank National Trust Company
Bought by
Bred & C Llc
Purchase Details
Closed on
Mar 10, 2009
Sold by
Pierson Mary
Bought by
Deutsche Bank National Trust Company
Purchase Details
Closed on
Dec 27, 2000
Sold by
Carter Mary C
Bought by
Pierson Mary
Create a Home Valuation Report for This Property
The Home Valuation Report is an in-depth analysis detailing your home's value as well as a comparison with similar homes in the area
Home Values in the Area
Average Home Value in this Area
Purchase History
| Date | Buyer | Sale Price | Title Company |
|---|---|---|---|
| Owens Jasmine | -- | Continental Title | |
| Rose Alisha | -- | None Available | |
| Bred & C Llc | -- | Mokan Title Services Llc | |
| Deutsche Bank National Trust Company | $36,270 | None Available | |
| Pierson Mary | -- | Ati Title Company |
Source: Public Records
Mortgage History
| Date | Status | Borrower | Loan Amount |
|---|---|---|---|
| Open | Owens Jasmine | $99,170 | |
| Previous Owner | Rose Alisha | $73,904 |
Source: Public Records
Tax History Compared to Growth
Tax History
| Year | Tax Paid | Tax Assessment Tax Assessment Total Assessment is a certain percentage of the fair market value that is determined by local assessors to be the total taxable value of land and additions on the property. | Land | Improvement |
|---|---|---|---|---|
| 2025 | $1,295 | $13,066 | $2,616 | $10,450 |
| 2024 | $1,272 | $14,961 | $1,968 | $12,993 |
| 2023 | $1,272 | $14,960 | $1,571 | $13,389 |
| 2022 | $978 | $9,880 | $2,993 | $6,887 |
| 2021 | $844 | $9,880 | $2,993 | $6,887 |
| 2020 | $895 | $9,902 | $2,993 | $6,909 |
| 2019 | $846 | $9,902 | $2,993 | $6,909 |
| 2018 | $504 | $5,505 | $1,101 | $4,404 |
| 2017 | $504 | $5,505 | $1,101 | $4,404 |
| 2016 | $451 | $4,787 | $2,401 | $2,386 |
| 2014 | $437 | $4,693 | $2,354 | $2,339 |
Source: Public Records
Map
Nearby Homes
- 8416 E 92nd Place
- 8410 E 92nd Place
- 9203 Marsh Ave
- 7800 E 91st St
- 8103 E 89th St
- 8818 James A Reed Rd
- 8902 Manchester Ave
- 9211 Manchester Ave
- 7722 E 90th Terrace
- 7718 E 90th Terrace
- 9414 Lewis Ave
- 9006 Tennessee Ave
- 7701 E 90th Terrace
- 8700 E Bannister Terrace
- 9525 Wallace Ave
- 8021 E 88th St
- 8803 Manchester Ave
- 8711 Stark Ave
- 8706 Kentucky Ave
- 9609 Ditman Way
- 8503 E 91st St
- 8501 E 91st St
- 8505 E 91st St
- 8502 E 91st St
- 8507 E 91 St
- 8507 E 91st St
- 8506 E 91st St
- 8500 E 91st St
- 8502 E 91st Terrace
- 8500 E 91 St
- 8500 E 91st Terrace
- 8504 E 91st Terrace
- 8508 E 91st St
- 8409 E 91st St
- 8509 E 91st St
- 8410 E 91st St
- 8510 E 91st St
- 8508 E 91st Terrace
- 8407 E 91st St
- 8408 E 91st St