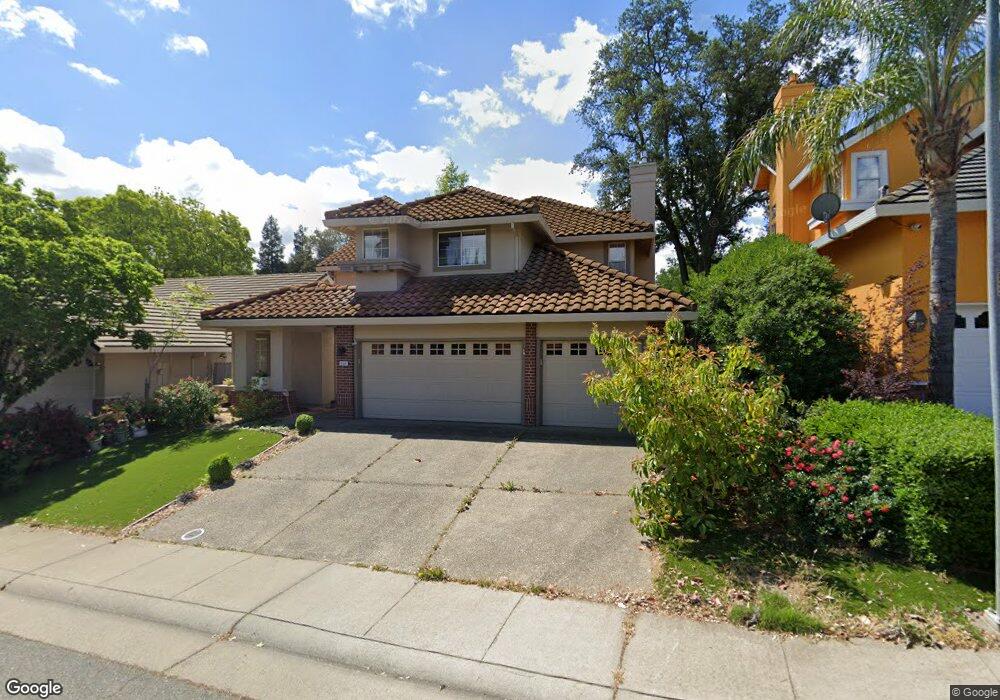
8504 Cloudcroft Way Orangevale, CA 95662
Estimated Value: $634,470 - $745,000
4
Beds
3
Baths
2,225
Sq Ft
$301/Sq Ft
Est. Value
About This Home
This home is located at 8504 Cloudcroft Way, Orangevale, CA 95662 and is currently estimated at $669,618, approximately $300 per square foot. 8504 Cloudcroft Way is a home located in Sacramento County with nearby schools including Oakview Community Elementary School, Louis Pasteur Fundamental Middle School, and Casa Roble Fundamental High School.
Ownership History
Date
Name
Owned For
Owner Type
Purchase Details
Closed on
Nov 10, 2009
Sold by
Leadmon Dain Roy and Leadmon Laraine Jane
Bought by
Narayanaswamy Perma and Balakrishna Vinod
Current Estimated Value
Home Financials for this Owner
Home Financials are based on the most recent Mortgage that was taken out on this home.
Original Mortgage
$298,493
Outstanding Balance
$193,203
Interest Rate
4.83%
Mortgage Type
FHA
Estimated Equity
$476,415
Purchase Details
Closed on
Jun 21, 1994
Sold by
Elliott Homes Inc
Bought by
Leadmon Dain Roy and Leadmon Laraine Jane
Home Financials for this Owner
Home Financials are based on the most recent Mortgage that was taken out on this home.
Original Mortgage
$202,300
Interest Rate
8.83%
Create a Home Valuation Report for This Property
The Home Valuation Report is an in-depth analysis detailing your home's value as well as a comparison with similar homes in the area
Home Values in the Area
Average Home Value in this Area
Purchase History
| Date | Buyer | Sale Price | Title Company |
|---|---|---|---|
| Narayanaswamy Perma | $304,000 | Chicago Title Company | |
| Leadmon Dain Roy | $213,045 | Stewart Title |
Source: Public Records
Mortgage History
| Date | Status | Borrower | Loan Amount |
|---|---|---|---|
| Open | Narayanaswamy Perma | $298,493 | |
| Previous Owner | Leadmon Dain Roy | $202,300 |
Source: Public Records
Tax History
| Year | Tax Paid | Tax Assessment Tax Assessment Total Assessment is a certain percentage of the fair market value that is determined by local assessors to be the total taxable value of land and additions on the property. | Land | Improvement |
|---|---|---|---|---|
| 2025 | $4,752 | $392,392 | $129,073 | $263,319 |
| 2024 | $4,752 | $384,699 | $126,543 | $258,156 |
| 2023 | $4,634 | $377,157 | $124,062 | $253,095 |
| 2022 | $4,610 | $369,763 | $121,630 | $248,133 |
| 2021 | $4,535 | $362,514 | $119,246 | $243,268 |
| 2020 | $4,454 | $358,798 | $118,024 | $240,774 |
| 2019 | $4,366 | $351,763 | $115,710 | $236,053 |
| 2018 | $4,314 | $344,867 | $113,442 | $231,425 |
| 2017 | $4,275 | $338,106 | $111,218 | $226,888 |
| 2016 | $4,005 | $331,478 | $109,038 | $222,440 |
| 2015 | $3,939 | $326,500 | $107,401 | $219,099 |
| 2014 | $3,860 | $320,106 | $105,298 | $214,808 |
Source: Public Records
Map
Nearby Homes
- 8457 N Star Way
- 8641 Stratus Dr
- 8437 Cobble Creek Ln
- 6051 Kenneth Oak Way
- 6219 Trajan Dr
- 8659 Blythe Ave
- 8583 Central Ave
- 5971 Long Acres Ct
- 8272 Woodlake Hills Dr
- 8752 Mellowdawn Way
- 6427 Wittenham Way
- 8754 Mellowdawn Way
- 8631 Posadera Ave
- 8643 Monica Ave
- 8770 Greenback Ln
- 8265 Northwind Way
- 8301 Central Ave
- 6129 Kifisia Way
- 6613 Mirwood Ct
- 6900 Almond Ave Unit 49
- 8500 Cloudcroft Way
- 8508 Cloudcroft Way
- 6225 Windorah Way
- 8505 Cloudcroft Way
- 8509 Cloudcroft Way
- 8523 Heather Cross Way
- 6221 Windorah Way
- 6238 Windorah Way
- 8474 North Star
- 8519 Cloudcroft Way
- 6341 Canopus Ave
- 6308 Kenneth Ave
- 8527 Heather Cross Way
- 6204 Asteroid Ct
- 8473 North Star
- 8470 N Star Way
- 8470 North Star
- 8523 Cloudcroft Way
- 6345 Canopus Ave
- 6312 Kenneth Ave
Your Personal Tour Guide
Ask me questions while you tour the home.