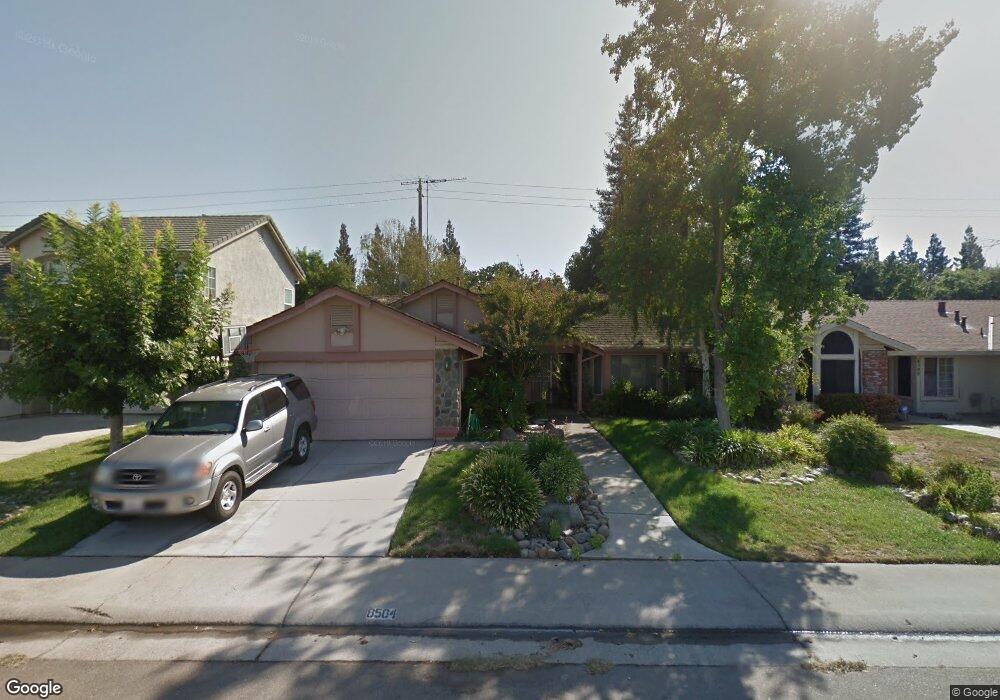
8504 Nandina Way Antelope, CA 95843
Estimated Value: $469,702 - $511,000
3
Beds
2
Baths
1,736
Sq Ft
$287/Sq Ft
Est. Value
About This Home
This home is located at 8504 Nandina Way, Antelope, CA 95843 and is currently estimated at $498,176, approximately $286 per square foot. 8504 Nandina Way is a home located in Sacramento County with nearby schools including Arthur S. Dudley Elementary School, Wilson C. Riles Middle School, and Center High School.
Ownership History
Date
Name
Owned For
Owner Type
Purchase Details
Closed on
Apr 19, 2004
Sold by
Baltazar Mary Lou A
Bought by
Baltazar Peter and Baltazar Mary Lou A
Current Estimated Value
Home Financials for this Owner
Home Financials are based on the most recent Mortgage that was taken out on this home.
Original Mortgage
$180,000
Interest Rate
5.39%
Mortgage Type
New Conventional
Purchase Details
Closed on
Nov 21, 2002
Sold by
Baltazar Peter A
Bought by
Baltazar Marylou A
Home Financials for this Owner
Home Financials are based on the most recent Mortgage that was taken out on this home.
Original Mortgage
$147,000
Interest Rate
5.89%
Purchase Details
Closed on
May 28, 1999
Sold by
Ibe Charles R and Gollbach Michael J
Bought by
Baltazar Peter A and Baltazar Marylou A
Home Financials for this Owner
Home Financials are based on the most recent Mortgage that was taken out on this home.
Original Mortgage
$137,083
Interest Rate
6.84%
Mortgage Type
FHA
Create a Home Valuation Report for This Property
The Home Valuation Report is an in-depth analysis detailing your home's value as well as a comparison with similar homes in the area
Home Values in the Area
Average Home Value in this Area
Purchase History
| Date | Buyer | Sale Price | Title Company |
|---|---|---|---|
| Baltazar Peter | -- | Commonwealth Land Title Co | |
| Baltazar Marylou A | -- | Alliance Title Company | |
| Baltazar Peter A | $138,000 | Commonwealth Land Title Co |
Source: Public Records
Mortgage History
| Date | Status | Borrower | Loan Amount |
|---|---|---|---|
| Closed | Baltazar Peter | $180,000 | |
| Closed | Baltazar Marylou A | $147,000 | |
| Closed | Baltazar Peter A | $137,083 |
Source: Public Records
Tax History Compared to Growth
Tax History
| Year | Tax Paid | Tax Assessment Tax Assessment Total Assessment is a certain percentage of the fair market value that is determined by local assessors to be the total taxable value of land and additions on the property. | Land | Improvement |
|---|---|---|---|---|
| 2025 | $2,535 | $216,321 | $62,695 | $153,626 |
| 2024 | $2,535 | $212,080 | $61,466 | $150,614 |
| 2023 | $2,481 | $207,922 | $60,261 | $147,661 |
| 2022 | $2,461 | $203,846 | $59,080 | $144,766 |
| 2021 | $2,529 | $199,850 | $57,922 | $141,928 |
| 2020 | $2,728 | $197,802 | $57,329 | $140,473 |
| 2019 | $2,486 | $193,924 | $56,205 | $137,719 |
| 2018 | $2,431 | $190,122 | $55,103 | $135,019 |
| 2017 | $2,359 | $186,395 | $54,023 | $132,372 |
| 2016 | $2,317 | $182,741 | $52,964 | $129,777 |
| 2015 | $2,150 | $179,997 | $52,169 | $127,828 |
| 2014 | $2,197 | $176,473 | $51,148 | $125,325 |
Source: Public Records
Map
Nearby Homes
- 8447 Leaning Tree Ct
- 3326 El Castillo Ct
- 3310 El Valle Way
- 3312 Groveland Way
- 8148 Orchid Tree Way
- 8162 Big Sky Dr
- 8413 Silver Run Way
- 8126 Great House Way
- 3313 Gray Mare Way
- 3512 Merano Way
- 8548 Brisenbourg Way
- 8404 Giverny Cir
- 3713 Black Eagle Dr
- 8529 Giverny Cir
- 8631 Aspen Ridge Ct
- 8522 Thornbury Dr
- 7984 Skeena Ct
- 8534 Shadow Crest Cir
- 2816 Balaton Ct
- 9640 Mirabelle St
- 8510 Nandina Way
- 8500 Nandina Way
- 8514 Nandina Way
- 2937 Meadow Hawk Way
- 8432 Nandina Way
- 8511 Nandina Way
- 8518 Nandina Way
- 8515 Nandina Way
- 8428 Nandina Way
- 2933 Meadow Hawk Way
- 3008 Tourmaline Way
- 8459 Gooseberry Ct
- 8424 Nandina Way
- 8455 Gooseberry Ct
- 8427 Nandina Way
- 2929 Meadow Hawk Way
- 3030 Black Eagle Dr
- 8451 Gooseberry Ct
- 3004 Tourmaline Way