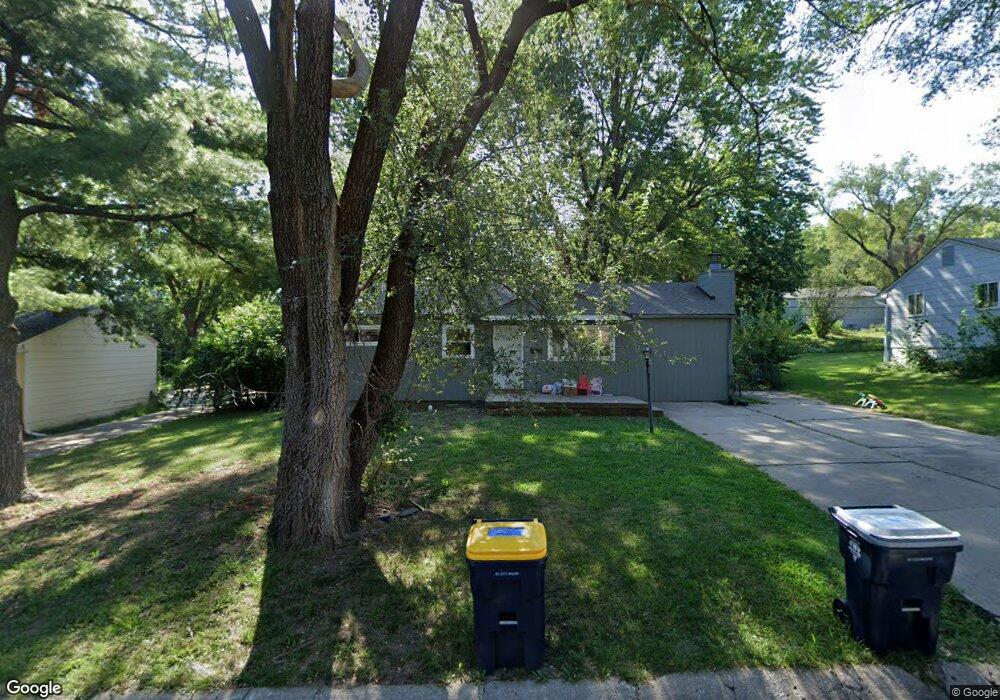
8505 Crystal Ave Kansas City, MO 64138
Oldham Farms NeighborhoodEstimated Value: $55,000 - $150,000
--
Bed
--
Bath
--
Sq Ft
7,754
Sq Ft Lot
About This Home
This home is located at 8505 Crystal Ave, Kansas City, MO 64138 and is currently estimated at $97,333. 8505 Crystal Ave is a home located in Jackson County with nearby schools including Spring Valley Elementary, South Middle School, and Carver Christian Academy.
Ownership History
Date
Name
Owned For
Owner Type
Purchase Details
Closed on
Dec 18, 2020
Sold by
Febbat Llc
Bought by
Bsfr Ii Owner I Llc
Current Estimated Value
Purchase Details
Closed on
Oct 31, 2006
Sold by
Kelley Tim and Kelley Lisa
Bought by
Fkgibbs Co Llc
Purchase Details
Closed on
Aug 30, 2006
Sold by
Fkgibbs Co Llc
Bought by
Porterfield Jerry and Porterfield Michelle
Home Financials for this Owner
Home Financials are based on the most recent Mortgage that was taken out on this home.
Original Mortgage
$64,000
Interest Rate
6.28%
Mortgage Type
Construction
Purchase Details
Closed on
Aug 21, 2000
Sold by
Muro Michael J and Muro Gabriella A
Bought by
Kelley Tim and Kelley Lisa
Home Financials for this Owner
Home Financials are based on the most recent Mortgage that was taken out on this home.
Original Mortgage
$67,433
Interest Rate
8.16%
Mortgage Type
FHA
Create a Home Valuation Report for This Property
The Home Valuation Report is an in-depth analysis detailing your home's value as well as a comparison with similar homes in the area
Home Values in the Area
Average Home Value in this Area
Purchase History
| Date | Buyer | Sale Price | Title Company |
|---|---|---|---|
| Bsfr Ii Owner I Llc | -- | Stewart Title Company | |
| Fkgibbs Co Llc | -- | Title Enterprises | |
| Porterfield Jerry | -- | Accurate Title Company Llc | |
| Kelley Tim | -- | Chicago Title Co |
Source: Public Records
Mortgage History
| Date | Status | Borrower | Loan Amount |
|---|---|---|---|
| Previous Owner | Porterfield Jerry | $64,000 | |
| Previous Owner | Kelley Tim | $67,433 |
Source: Public Records
Tax History Compared to Growth
Tax History
| Year | Tax Paid | Tax Assessment Tax Assessment Total Assessment is a certain percentage of the fair market value that is determined by local assessors to be the total taxable value of land and additions on the property. | Land | Improvement |
|---|---|---|---|---|
| 2025 | $343 | $4,034 | $4,034 | -- |
| 2024 | $341 | $3,789 | $3,789 | -- |
| 2023 | $341 | $3,789 | $3,789 | $0 |
| 2022 | $338 | $3,610 | $1,574 | $2,036 |
| 2021 | $338 | $3,610 | $1,574 | $2,036 |
| 2020 | $327 | $3,457 | $1,574 | $1,883 |
| 2019 | $321 | $3,457 | $1,574 | $1,883 |
| 2018 | $278 | $3,009 | $1,370 | $1,639 |
| 2017 | $270 | $3,009 | $1,370 | $1,639 |
| 2016 | $270 | $2,934 | $1,370 | $1,564 |
| 2014 | $263 | $4,423 | $1,330 | $3,093 |
Source: Public Records
Map
Nearby Homes
- 8604 Corrington Ave
- 6906 E 86th St
- 9250 Blue Ridge Blvd
- 8704 Manchester Ave
- 7809 E 87th St
- 7814 E 86th St
- 8400 Blue Ridge Blvd
- 8416 Greenwood Rd
- 8803 Manchester Ave
- 8021 E 88th St
- 8902 Manchester Ave
- 7413 Loma Vista Dr
- 7718 E 90th Terrace
- 7722 E 90th Terrace
- 7701 E 90th Terrace
- 8005 E 90th St
- 8512 E 85th St
- 8115 E 80th Terrace
- 9204 Blue Ridge Blvd
- 8604 E 84th Terrace
- 8505 Crystal Ave
- 8505 Crystal Ave
- 8503 Crystal Ave
- 8507 Crystal Ave
- 8502 Crystal Ave
- 8504 Crystal Ave
- 8509 Crystal Ave
- 8508 Eastern Ave
- 8510 Eastern Ave
- 7305 E 85th Terrace
- 8511 Crystal Ave
- 8506 Eastern Ave
- 8508 Crystal Ave
- 8512 Eastern Ave
- 7401 E 85th Terrace
- 8504 Eastern Ave
- 7303 E 85th Terrace
- 8514 Eastern Ave
- 7403 E 85th Terrace
- 8510 Crystal Ave