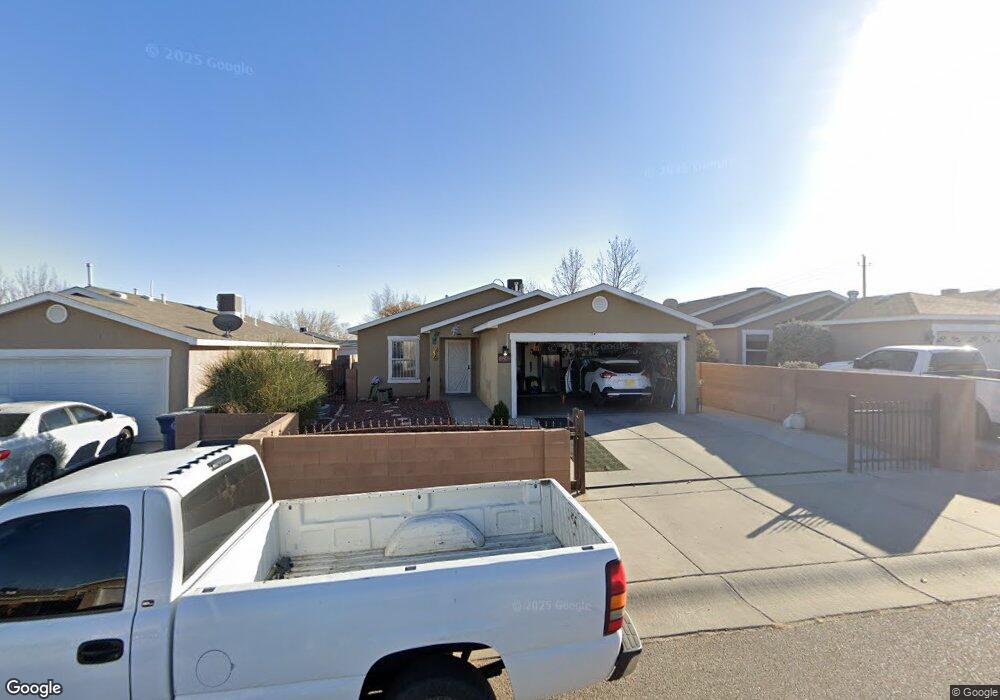
8508 Mesa Roja Ave SW Albuquerque, NM 87121
Southwest Heights NeighborhoodEstimated Value: $242,000 - $281,000
3
Beds
2
Baths
1,283
Sq Ft
$204/Sq Ft
Est. Value
About This Home
This home is located at 8508 Mesa Roja Ave SW, Albuquerque, NM 87121 and is currently estimated at $261,361, approximately $203 per square foot. 8508 Mesa Roja Ave SW is a home located in Bernalillo County with nearby schools including Helen Cordero Primary School, Edward Gonzales Elementary School, and Truman Middle School.
Ownership History
Date
Name
Owned For
Owner Type
Purchase Details
Closed on
Feb 2, 2022
Sold by
Garcia Joseph J
Bought by
Peterson Joseph Scott
Current Estimated Value
Purchase Details
Closed on
Jul 16, 2013
Sold by
Garcia Joseph and Garcia Joseph
Bought by
Garcia Joseph
Home Financials for this Owner
Home Financials are based on the most recent Mortgage that was taken out on this home.
Original Mortgage
$90,950
Interest Rate
4.4%
Mortgage Type
FHA
Purchase Details
Closed on
Apr 15, 2010
Sold by
Garcia Elizabeth
Bought by
Garcia Joseph
Purchase Details
Closed on
May 5, 2004
Sold by
Artistic Homes Inc
Bought by
Garcia Joseph and Garcia Elizabeth
Home Financials for this Owner
Home Financials are based on the most recent Mortgage that was taken out on this home.
Original Mortgage
$105,396
Interest Rate
5.38%
Mortgage Type
Purchase Money Mortgage
Create a Home Valuation Report for This Property
The Home Valuation Report is an in-depth analysis detailing your home's value as well as a comparison with similar homes in the area
Home Values in the Area
Average Home Value in this Area
Purchase History
| Date | Buyer | Sale Price | Title Company |
|---|---|---|---|
| Peterson Joseph Scott | -- | Old Republic National Title | |
| Garcia Joseph | -- | None Available | |
| Garcia Joseph | -- | None Available | |
| Garcia Joseph | -- | First American Title Ins Co |
Source: Public Records
Mortgage History
| Date | Status | Borrower | Loan Amount |
|---|---|---|---|
| Previous Owner | Garcia Joseph | $90,950 | |
| Previous Owner | Garcia Joseph | $105,396 |
Source: Public Records
Tax History Compared to Growth
Tax History
| Year | Tax Paid | Tax Assessment Tax Assessment Total Assessment is a certain percentage of the fair market value that is determined by local assessors to be the total taxable value of land and additions on the property. | Land | Improvement |
|---|---|---|---|---|
| 2025 | $1,802 | $46,056 | $10,857 | $35,199 |
| 2024 | $1,802 | $44,715 | $10,541 | $34,174 |
| 2023 | $1,770 | $43,413 | $10,234 | $33,179 |
| 2022 | $1,708 | $42,148 | $9,936 | $32,212 |
| 2021 | $1,648 | $40,922 | $9,647 | $31,275 |
| 2020 | $1,618 | $39,730 | $9,366 | $30,364 |
| 2019 | $1,603 | $39,388 | $10,541 | $28,847 |
| 2018 | $1,544 | $39,388 | $10,541 | $28,847 |
| 2017 | $1,494 | $38,241 | $10,234 | $28,007 |
| 2016 | $1,449 | $36,047 | $9,647 | $26,400 |
| 2015 | $34,997 | $34,997 | $9,366 | $25,631 |
| 2014 | $1,401 | $34,997 | $9,366 | $25,631 |
| 2013 | -- | $35,263 | $9,366 | $25,897 |
Source: Public Records
Map
Nearby Homes
- 921 Roma Dora Ln
- 0 Sage & 90th St SW Unit 1083191
- 0 Nwq Unser and Sage SW Unit 1081546
- 8809 Tenemaha Ave SW
- 0 Sage Rd SW Unit 1085259
- 8523 Vista Serena Ln SW
- 8308 Vista Chamisa Ln SW
- 3525 Tower Rd SW
- 8315 Vista Chamisa Ln SW
- 615 82nd St SW
- 780 Jaconita Place SW
- 10737 Sabino Loop SW
- 9300 Jenny Ave SW
- 1209 Locura Rd SW
- 0 Nna Unser&tower SW Unit 1081416
- 7605 Windsong Place SW
- 9401 Reba Ave SW
- 519 Fenwick Place SW
- 575 94th St SW
- 537 Sky Tower St SW
- 8504 Mesa Roja Ave SW
- 8512 Mesa Roja Ave SW
- 8516 Mesa Roja Ave SW
- 8500 Mesa Roja Ave SW
- 8509 Mesa Camino Ave SW
- 8515 Mesa Camino Ave SW
- 8505 Mesa Camino Ave SW
- 8519 Mesa Camino Ave SW
- 8501 Mesa Camino Ave SW
- 8509 Mesa Roja Ave SW
- 8515 Mesa Roja Ave SW
- 8519 Mesa Roja Ave SW
- 8501 Mesa Roja Ave SW
- 8505 Mesa Roja Ave SW
- 900 Mesa Viejo St SW
- 904 Mesa Viejo St SW
- 836 Mesa Viejo St SW
- 832 Mesa Viejo St SW
- 908 Mesa Viejo St SW
- 8508 Mesa Entrada Ave SW