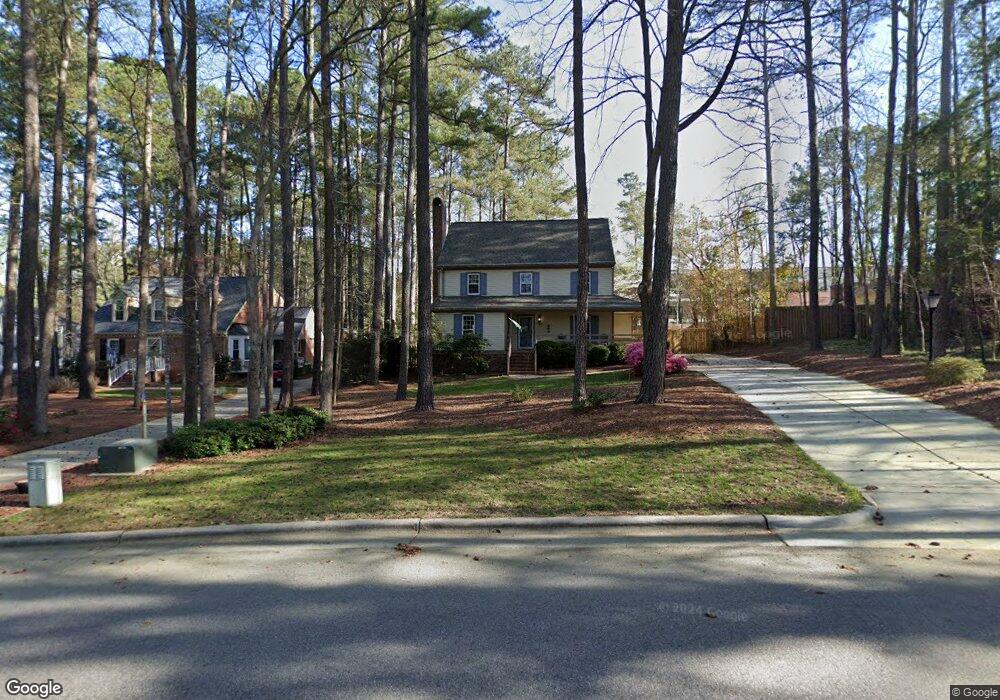
8509 Mourning Dove Rd Raleigh, NC 27615
Six Forks NeighborhoodEstimated Value: $582,549 - $649,000
4
Beds
3
Baths
2,132
Sq Ft
$285/Sq Ft
Est. Value
About This Home
This home is located at 8509 Mourning Dove Rd, Raleigh, NC 27615 and is currently estimated at $608,637, approximately $285 per square foot. 8509 Mourning Dove Rd is a home located in Wake County with nearby schools including North Ridge Elementary School, West Millbrook Middle School, and Sanderson High School.
Ownership History
Date
Name
Owned For
Owner Type
Purchase Details
Closed on
Mar 15, 2021
Sold by
Simpkins Rodney L
Bought by
Tamargo Colleen and Wyatt Matthew
Current Estimated Value
Home Financials for this Owner
Home Financials are based on the most recent Mortgage that was taken out on this home.
Original Mortgage
$340,000
Outstanding Balance
$304,786
Interest Rate
2.7%
Mortgage Type
New Conventional
Estimated Equity
$303,851
Purchase Details
Closed on
Jan 28, 1999
Sold by
Mosher Gregory P
Bought by
Simpkins Rodney L and Simpkins Kimberly B
Home Financials for this Owner
Home Financials are based on the most recent Mortgage that was taken out on this home.
Original Mortgage
$156,000
Interest Rate
6.72%
Create a Home Valuation Report for This Property
The Home Valuation Report is an in-depth analysis detailing your home's value as well as a comparison with similar homes in the area
Home Values in the Area
Average Home Value in this Area
Purchase History
| Date | Buyer | Sale Price | Title Company |
|---|---|---|---|
| Tamargo Colleen | $450,000 | None Available | |
| Tamargo Colleen | $450,000 | None Listed On Document | |
| Simpkins Rodney L | $195,000 | -- |
Source: Public Records
Mortgage History
| Date | Status | Borrower | Loan Amount |
|---|---|---|---|
| Open | Tamargo Colleen | $340,000 | |
| Closed | Tamargo Colleen | $340,000 | |
| Previous Owner | Simpkins Rodney L | $156,000 |
Source: Public Records
Tax History Compared to Growth
Tax History
| Year | Tax Paid | Tax Assessment Tax Assessment Total Assessment is a certain percentage of the fair market value that is determined by local assessors to be the total taxable value of land and additions on the property. | Land | Improvement |
|---|---|---|---|---|
| 2025 | $4,522 | $516,214 | $240,000 | $276,214 |
| 2024 | $4,503 | $516,214 | $240,000 | $276,214 |
| 2023 | $3,558 | $324,623 | $125,000 | $199,623 |
| 2022 | $3,307 | $324,623 | $125,000 | $199,623 |
| 2021 | $3,179 | $324,623 | $125,000 | $199,623 |
| 2020 | $3,121 | $324,623 | $125,000 | $199,623 |
| 2019 | $3,315 | $284,289 | $120,000 | $164,289 |
| 2018 | $3,126 | $284,289 | $120,000 | $164,289 |
| 2017 | $2,977 | $284,289 | $120,000 | $164,289 |
| 2016 | $2,916 | $284,289 | $120,000 | $164,289 |
| 2015 | $3,112 | $298,591 | $132,000 | $166,591 |
| 2014 | $2,952 | $298,591 | $132,000 | $166,591 |
Source: Public Records
Map
Nearby Homes
- 127 Skylark Way
- 8713 Mourning Dove Rd
- 8304 Wycombe Ln
- 8716 Mourning Dove Rd
- 8112 Running Cedar Trail
- 723 Weathergreen Dr
- 747 Weathergreen Dr
- 8009 Running Cedar Trail
- 8325 Stryker Ct
- 7716 Fiesta Way
- 8305 Society Place
- 7412 Penny Hill Ln
- 7929 Featherstone Dr
- 7715 Kingsberry Ct
- 7731 Kingsberry Ct
- 7401 Fiesta Way
- 7317 Sweet Bay Ln
- 206 Nouveau Ave
- 42 Renwick Ct
- 107 Berry Mill Ln Unit 134
- 8505 Mourning Dove Rd
- 8305 N Crestwyck Ct
- 8301 N Crestwyck Ct
- 8300 Clear Brook Dr
- 8309 N Crestwyck Ct
- 8304 Clear Brook Dr
- 8508 Mourning Dove Rd
- 8232 Clear Brook Dr
- 7800 Alliance Ct
- 8219 Lloyds Way
- 8308 Clear Brook Dr
- 8205 S Crestwyck Ct
- 205 W
- 8308 N Crestwyck Ct
- 8228 Clear Brook Dr
- 8301 Clear Brook Dr
- 8300 N Crestwyck Ct
- 8304 N Crestwyck Ct
- 8305 Clear Brook Dr
- 8208 S Crestwyck Ct