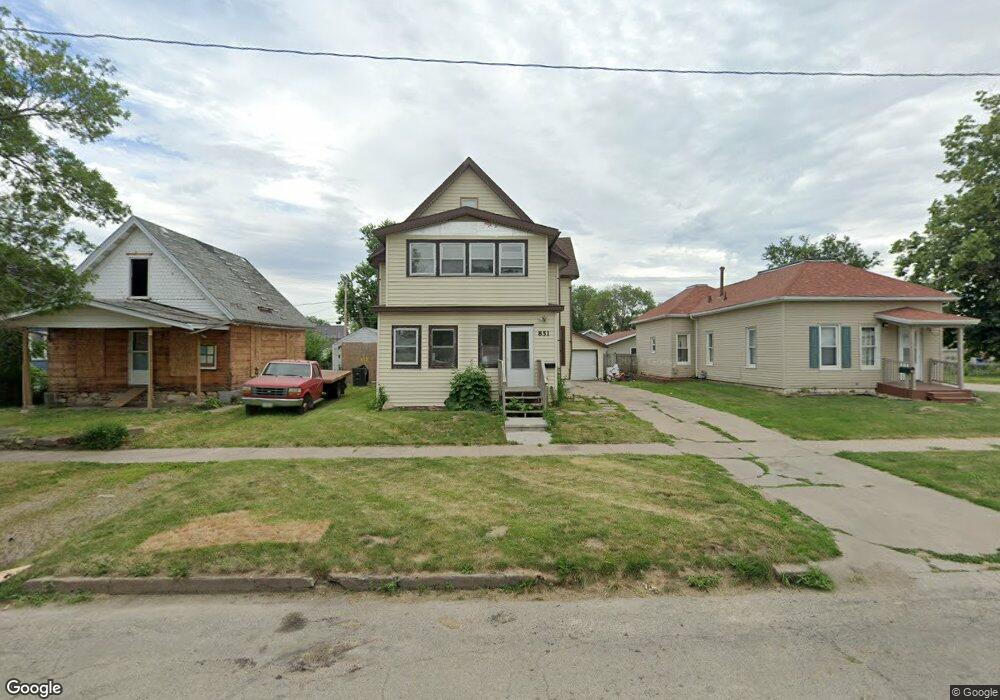
851 10th St SW Cedar Rapids, IA 52404
Taylor NeighborhoodEstimated Value: $136,000 - $148,000
3
Beds
1
Bath
1,240
Sq Ft
$116/Sq Ft
Est. Value
About This Home
This home is located at 851 10th St SW, Cedar Rapids, IA 52404 and is currently estimated at $143,466, approximately $115 per square foot. 851 10th St SW is a home located in Linn County with nearby schools including Junction City Elementary School, Cedar River Academy at Taylor Elementary School, and Bruce Hall Day Treatment Center.
Ownership History
Date
Name
Owned For
Owner Type
Purchase Details
Closed on
May 30, 2023
Sold by
Morton Paul W and Morton Julie A
Bought by
Jrb Properties Llc
Current Estimated Value
Home Financials for this Owner
Home Financials are based on the most recent Mortgage that was taken out on this home.
Original Mortgage
$80,500
Outstanding Balance
$77,291
Interest Rate
6.39%
Mortgage Type
New Conventional
Estimated Equity
$66,175
Create a Home Valuation Report for This Property
The Home Valuation Report is an in-depth analysis detailing your home's value as well as a comparison with similar homes in the area
Home Values in the Area
Average Home Value in this Area
Purchase History
| Date | Buyer | Sale Price | Title Company |
|---|---|---|---|
| Jrb Properties Llc | $57,500 | None Listed On Document |
Source: Public Records
Mortgage History
| Date | Status | Borrower | Loan Amount |
|---|---|---|---|
| Open | Jrb Properties Llc | $80,500 |
Source: Public Records
Tax History Compared to Growth
Tax History
| Year | Tax Paid | Tax Assessment Tax Assessment Total Assessment is a certain percentage of the fair market value that is determined by local assessors to be the total taxable value of land and additions on the property. | Land | Improvement |
|---|---|---|---|---|
| 2025 | $2,056 | $125,900 | $28,200 | $97,700 |
| 2024 | $1,946 | $117,800 | $24,800 | $93,000 |
| 2023 | $1,946 | $116,200 | $24,800 | $91,400 |
| 2022 | $1,742 | $92,300 | $21,400 | $70,900 |
| 2021 | $1,740 | $84,100 | $21,400 | $62,700 |
| 2020 | $1,740 | $78,900 | $16,900 | $62,000 |
| 2019 | $1,652 | $76,600 | $16,900 | $59,700 |
| 2018 | $1,606 | $76,600 | $16,900 | $59,700 |
| 2017 | $1,670 | $79,600 | $16,900 | $62,700 |
| 2016 | $1,670 | $78,600 | $16,900 | $61,700 |
| 2015 | $1,766 | $83,000 | $16,931 | $66,069 |
| 2014 | $1,766 | $87,206 | $16,125 | $71,081 |
| 2013 | $1,816 | $87,206 | $16,125 | $71,081 |
Source: Public Records
Map
Nearby Homes